Unsubscribe![]() Punch these codes into your ordinary brokerage account (From Brownstone Research)
Punch these codes into your ordinary brokerage account (From Brownstone Research)
Market Momentum: 3 Stocks Poised for Major Breakouts
Written by Ryan Hasson

Following a sharp correction in November, sparked by a tech-ledpullback, concerns over AI capital expenditure payoffs and renewed anxiety about the pace of rate cuts have led to a surprising rebound in the broader market. The S&P 500 now sits just 1% below its all-time high, and with a Fed decision approaching where odds strongly favor a 25 bps cut, investors are once again positioning for upside into year-end.
In this environment of rising momentum and improving sentiment, a handful of stocks are setting up for potential breakouts. Three in particular stand out, each sitting just below critical resistance levels and showing technical and fundamental strength that could fuel meaningful continuation.
GE Vernova: Breaking Out of a 5-Month Bull Flag
GE Vernova Inc. (NYSE: GEV) has quietly become one of the strongest industrial names in the S&P 500 this year, rallying an impressive 90% year-to-date (YTD). What makes that performance even more notable is how much of it came before the most recent move. For nearly five months, GEV traded sideways in a well-defined bull-flag structure, tightening gradually and waiting for a catalyst.
That catalyst arrived on Tuesday, Dec. 9. The company announced a dividend doubling, raised full-year guidance, and expanded its stock buyback authorization, all in one update. The reaction was immediate. Shares surged in after-hours trading, blasting through the key $675 resistance level that had capped the bull flag since early summer. By early Wednesday, the stock was trading around $679, marking a clean breakout from its multimonth consolidation.
From a technical perspective, this is one of the most attractive higher-timeframe setups in the market right now. If GEV can hold above the former resistance at $675, the breakout could carry meaningful continuation into early 2026. Institutional flows back this up, with the stock seeing $23.5 billion in inflowsversus $16.8 billion in outflows over the past 12 months, a vote of confidence that aligns strongly with the breakout.
Tesla: Coiling Under All-Time Highs With Robotics Tailwinds
Tesla Inc. (NASDAQ: TSLA) hasn’t shared much of the spotlight this year, at least relative to its Tech peers. Up just 10% YTD, it has lagged the big-cap tech sector. But under the surface, Tesla’s chart has been quietly strengthening. The stock has been building a tight multi-timeframe consolidation directly beneath a central breakout zone at $475, which sits just below its all-time high at $488.
If Tesla can maintain this tight structure, and if bullish momentum carries through year-end, the stage is set for a potential high-velocity breakout. A decisive move above $475 would likely trigger a wave of momentum buying and short-term repricing, especially as Tesla increasingly gains recognition as one of the leading players in humanoid robotics.
Sentiment on Tesla remains its usual mixed bag, with the stock rated a Hold. However, the real story is in institutional behavior. Over the prior 12 months, Tesla saw massive inflows of $106 billion, compared with $44 billion in outflows. That scale of accumulation is hard to ignore and hints that big money is positioning for something larger beneath the surface.
TeraWulf: Tight Consolidation With High Short Interest Fuel
The most speculative name in this group, but potentially the most explosive, is TeraWulf Inc. (NASDAQ: WULF). The mid-cap digital asset infrastructure company focuses on zero-carbon bitcoin mining, integrating sustainable power with advanced data-center operations. With bitcoin strengthening and clean-energy mining gaining traction, WULF sits at an interesting intersection of themes.
Technically, the stock has spent more than two months consolidating just below its 52-week highs, forming a constructive base between $16 and $17. What makes this setup particularly compelling is the 32% short floatreported as of mid-November. That level of bearish positioning means any breakout above resistance could trigger a significant short-covering rally, amplifying upside momentum. READ THIS STORY ONLINE
Buy Alert (Ad)

Most investors won’t touch stocks under $10.
They think “cheap” means “junk.” They’re wrong.
While the crowd chases the same overpriced tech giants, a handful of sub-$10 stocks just triggered massive catalysts that Wall Street hasn’t fully priced in yet.
The smartest money always moves before the crowd realizes what’s happening.CLICK HERE TO GET YOUR FREE COPY OF THIS REPORT
3 Reasons Casey’s General Stores Will Continue Trending Higher
Written by Thomas Hughes

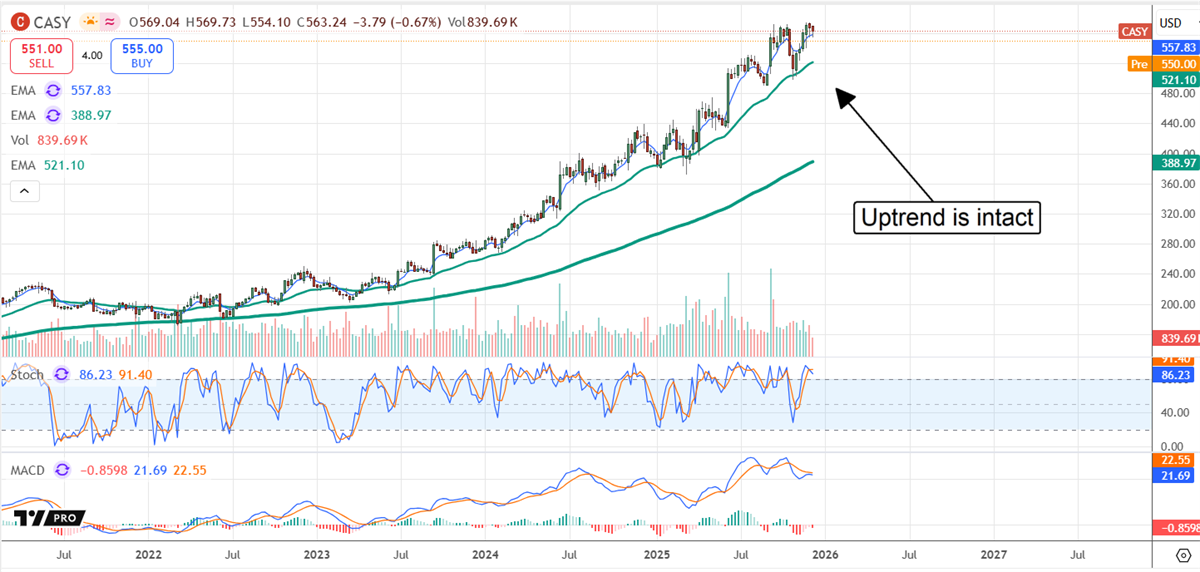
There are three reasons Casey’s General Stores’ (NASDAQ: CASY)stock price will likely continue to trend higher despite valuation concerns. The stock isn’t cheap in late 2025, trading at approximately 33 times its current-year earnings. Still, this price reflects a reliable growth trajectory, suggesting deep value for long-term, buy-and-hold investors.
The stock is trading at approximately 10 times its 2035 earnings outlook, suggesting a potential 100% upside in stock price over the coming years. Below, we’ll explore three good reasons investors could expect the stock to trend higher in 2026—growth, cash flow and capital returns, and broad market support.
Reason #1: Casey’s Revealed Momentum in Its FQ2 Report
Casey’s General Stores had a solid fiscal second quarter (FQ2), with earnings results showing strength and momentum, which is expected to carry through to the fiscal year-end. The $4.51 billion in net revenue grew 14.2% year-over-year (YOY), outpacing the consensus by a slim margin, driven by new-store growth and comp-store growth. The store count is up 9% YOY and 0.6% year-to-date (YTD), driven by last year’s Fike’s acquisition.
Strength was seen in both the inside and outside segments, with total inside sales up by 13%, inside comps up 3.3%, and fuel gallon comps up by 0.8%.
Within the Inside segment, both the grocery and prepared foods sub-segments showed strength, including at the margin.
The company widened its fuel margin, offsetting increased costs in other areas, to maintain a solid margin compared to the prior year. This margin strength led to an EBITDA increase of 17.5%, net income and GAAP earnings increase of 14%, and GAAP EPS of 33 cents.
Notably, the 33-cent EPS was 630 basis points better than MarketBeat’s reported consensus forecast. These results support an improved outlook for full-year profitability, with operating momentum expected to continue into 2026.
Reason #2: Casey’s Generates Healthy Cash Flows and Value
While Casey’s operates with modest margins typical of the retail sector, its operational efficiency and balance sheet strength enable it to generate substantial free cash flow. In FQ2, positive cash flow contributed to balance sheet improvements, with assets growing faster than liabilities. Total liabilities are low at 1.25 times the equity, and equity is rising. Shareholder equity increased by 8% YTD in addition to the dividend payments and share buybacks.
Neither the dividend nor the buybacks could be called aggressive. Rather, they are disciplined and consistent. The 0.4% yield as of mid-December is only 10% of the earnings forecast and expected to grow annually. The company is a Dividend Aristocrat and is on track to extend its streak to 50 years and achieve Dividend King status.
The buybacks are less robust but reduce the count incrementally each quarter. Investors should note that Casey’s share count is up YOY in the quarter due to capital-preserving activity ahead of the Fikes acquisition. Buybacks have resumed, reduced the share count in FQ2, and are expected to continue in 2026.
Reason #3: Casey’s Has Broad Market Support
While the earnings results, momentum, and capital return all provide incentives to buy and own this stock, it is the broad market supportthat drives its price higher over time.
The support is evident in analyst and institutional activity, which reveals a high ownership rate and a tendency toward accumulation. Analysts who rate the stock as a Moderate Buy have been raising their 2026 price targets, and the trend continues following the FQ2 release.
The first update includes a price target increase from RBC, which sees this stock trading at an above-consensus $591, sufficient for a new all-time high. Institutions own 85% of the stock and bought on balance in every quarter of 2026, running a balance of approximately $2 bought for each $1 sold. READ THIS STORY ONLINE
Punch these codes into your ordinary brokerage account (Ad)


If your retirement strategy involves “picking the right stocks,” you’re one crash away from disaster…
A hedge fund legend who made $95 million in profits during a crash has a different way.
He’s using 18-digit codes to “skim” the market without buying stocks.
And his followers have seen an 84%-win rate. CLICK HERE TO SEE HOW HE DOES IT
Golden Cross Alert: 3 Stocks With Major Upside Potential
Written by Chris Markoch

The golden cross is a highly accurate and bullish technical signal that investors can use to find stocks that can make good momentum trades. A golden cross pattern forms when a stock’s 50-day moving average crosses above its 200-day moving average. This pattern confirms that near-term momentum is strong enough to outweigh months of prior price movement.
The golden cross is also the preferred signal of many computer trading programs. When this pattern forms, it often triggers increased volume, including short covering that reinforces a strong move higher.
Golden cross patterns are typically, although not always, associated with longer-term bull cycles. However, buy-and-hold investors will want to see this signal supported by strong fundamentals before adding to a position with conviction. That could be the case with these three stocks that could present a golden cross setup.
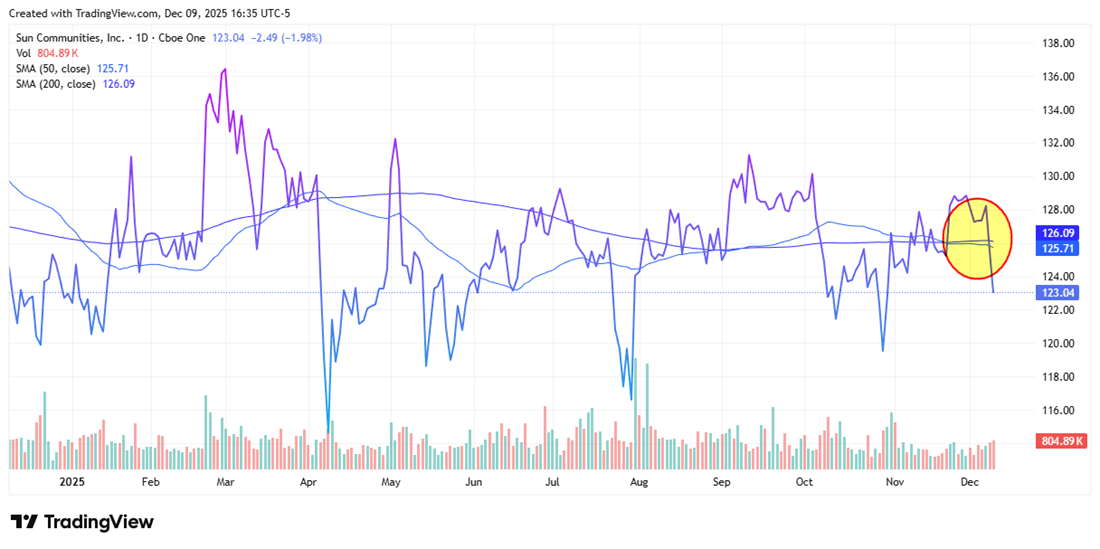
Sun Communities Positioned as a Momentum Play for 2026
Sun Communities Inc. (NYSE: SUI)could be one of the best examples of a momentum play for 2026. SUI stock is flat in 2025, but analysts forecast about 12% upside from its closing price on Dec. 9.
However, many analysts believe 2026 could be a strong year for real estate investment trusts (REITs). REITs are known for paying high-yield dividends, which become more attractive to income-oriented investors when interest rates are moving lower.
However, Sun Communities may have another catalyst. The company specializes in the acquisition, ownership, and operation of manufactured home communities. This is becoming a more appealing option for first-time homebuyers as well as retirees who are ready to trade down.
Many of these homes can be rented initially, and then the renters can eventually own the house. That can make it an option for consumers who may not be able to obtain conventional financing.
The company’s topline revenue was down sharply year-over-year (YOY)in its most recent quarter. That was due, in large part, to the company’s exposure to the recreational vehicle (RV) business.
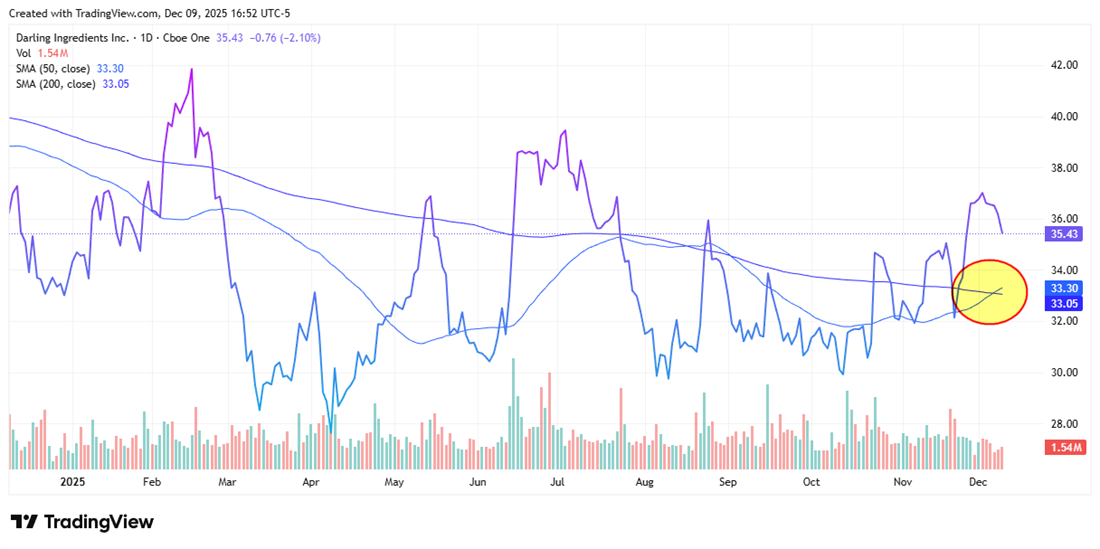
Darling Ingredients Emerges as a Golden Cross Contender
Darling Ingredients Inc. (NYSE: DAR) is the next golden cross candidate that could be ready for a sustained move. DAR stock is up more than 9% in the last month, when many stocks have been selling off.
The company is a global leader in converting edible and inedible bio-nutrient streams into sustainable food, feed ingredients, renewable fuels, and specialty products. Darling appears to be well-positioned heading into 2026, supported by favorable biofuel policy trends that may promote strong demand and pricing for fats and used cooking oil (UCO).
Analysts are raising their price targets for DAR stock on the heels of the company’s solid earnings report in late October. On the top line, the company reported YOY revenue growth of 10%, more than the 2% it made in the prior quarter. The company also saw 9% YOY earnings per share (EPS) growth; it had negative YOY growth in the prior quarter.
The consensus price target of $45.33is more than 27% above the current price. That outlook is buoyed by expectations of 44% earnings growth in the next 12 months.
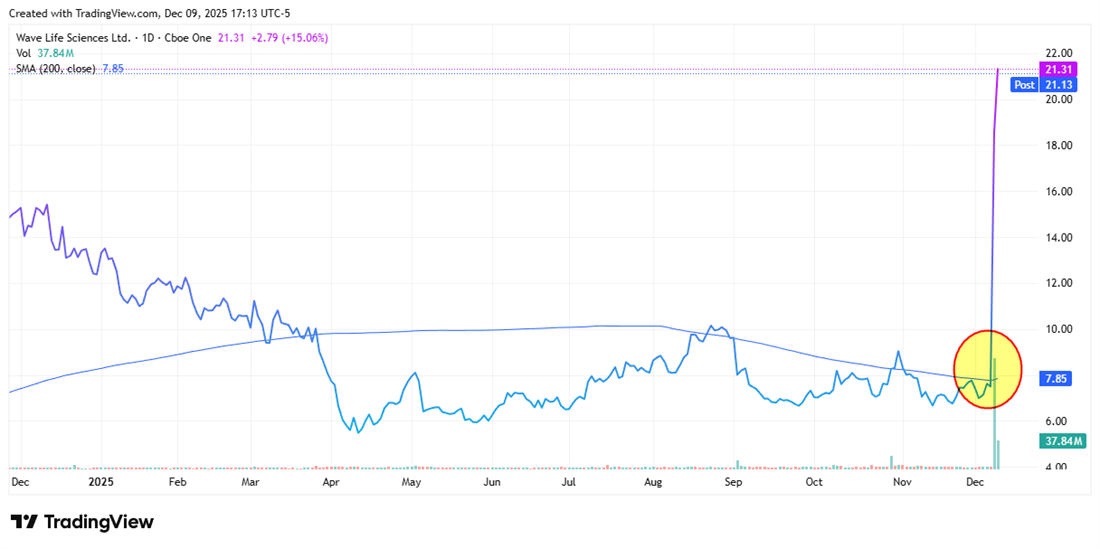
Wave Life Sciences Surges After Positive Phase 1 Obesity Data
The last company on this list is a pure momentum trade for now. In fact, some traders will say that the golden cross bump has already happened. Wave Life Sciences (NASDAQ: WVE) stock shot up nearly 180% on Dec. 8 on news that its lead candidate showed positive Phase 1 results in the treatment of obesity.
The market for obesity drugs is expected to surge higher for the rest of this decade, and likely longer. There’s room for more than one player in this space, which is currently dominated by Eli Lilly & Co. (NYSE: LLY) and Novo Nordisk A/S (NYSE: NVO).
Despite this jump, analysts believe WVE stock has more room to run. The consensus price target is $27.46, which would be a jump of nearly 30%.
Having said that, Wave Life Sciences is a clinical-stage company that is not profitable and has little revenue. That means the company’s fortunes depend on getting this drug across the finish line. That’s likely to be two years away or more. Investors will need patience and time to reap the big reward in WVE stock.
These 5 stocks could move before Wall Street catches on (Ad)

Warren Buffett is the greatest value investor of all time. But even the Oracle of Omaha has limits.
Because of Berkshire Hathaway’s size, Buffett simply can’t invest in small-cap stocks without taking controlling stakes. That means some of the market’s most promising companies are completely off his radar.
But they don’t have to be off yours.
We’ve put together a brand-new report profiling 5 small-cap stocks that check all the boxes of Buffett’s investing criteria solid financials, durable business models, strong management, and clear growth catalysts.
The only difference?
These stocks are flying under Wall Street’s radar and still accessible to individual investors like you.>> CLICK HERE TO GET YOUR FREE COPY OF THIS REPORT
More Stories
- Consumers Got Coal, But Santa Dropped Off Big Gains for These 2 Retailers
- Office Suite Gets Pricier: Microsoft’s Bold Move Comes With Risk
- 5 Best Stocks Under $5 to Buy Now (Ad)
- 10X Gains? These 3 Robotics Stocks Could Explode by 2035
- Apple Stock Could Surge on Record iPhone Sales and Bold AI Strategy
- Insiders Are Selling These 3 Stocks—Here’s Why
- Dividend Growth Is Heating Up: 3 Stocks With Steady Payout Gains
The Night Owl is a financial newsletter that provides in-depth market analysis on stocks of interest to individual investors. Published by MarketBeat and Early Bird Publishing, The Night Owl is delivered around 9:00 PM Eastern Sunday through Thursday. If you give a hoot about the market, The Night Owl is the newsletter for you.
If you need assistance with your account, please feel free to contact MarketBeat’s South Dakota based support team at contact@marketbeat.com.
Unsubscribe
© 2006-2025 MarketBeat Media, LLC.
345 N Reid Pl., Sixth Floor, Sioux Falls, S.D. 57103-7078. U.S.A..
Today’s Bonus Content: AI Continues to Surge—Here Are 2 Stocks Still Under $15 (Click to Opt-In)
