![]()
“The CEO called the bottom. Earnings proved it.”
Nate Bear, Lead Technical Tactician, Monument Traders Alliance

For three years, farmers pulled back.
Input costs ran too high, and commodity prices ran too low. The big green tractors sat on dealer lots.
Deere felt it all — full-year net income dropped 29% in fiscal 2025 as the agricultural downcycle ground through its core business.
Then, in December, CEO John May made a call: 2026 is the bottom.
The Earnings Made It Real
Calling the bottom is one thing. Proving it is another.
In February, Deere reported Q1 2026 earnings. The street expected continued weakness.
What they got: EPS of $2.42 against a $2.02 estimate, a 20% beat. Revenue of $9.61 billion against $7.59 billion expected, a 26% beat. The Construction and Forestry order bank rose more than 50% in a single quarter. Large tractor orders extended into Q4.
The stock gapped up 12% on the print. One quarter like that does not happen by accident. The story had changed.
Yesterday, a Wall Street analyst upgraded DE and cited the same thesis — the agricultural cycle may be nearing its bottom.
DE closed up +5%. The market is repricing this stock because the fundamentals continue to support the thesis.
What the Chart Is Saying
SPONSORED
Trump’s Spending Bill Passed: Four “Golden Anomaly” Stocks Could Soar
Trump’s “Big Beautiful Bill” passed! That means the US is on track for $60 trillion in debt by 2035 – by the government’s own calculation. Gold is already up more than 60% since 2024. What do you think will happen as purchasing power continues to disappear?
Go here to learn about the top four miners with 100X potential selling at discounts as deep as 90%
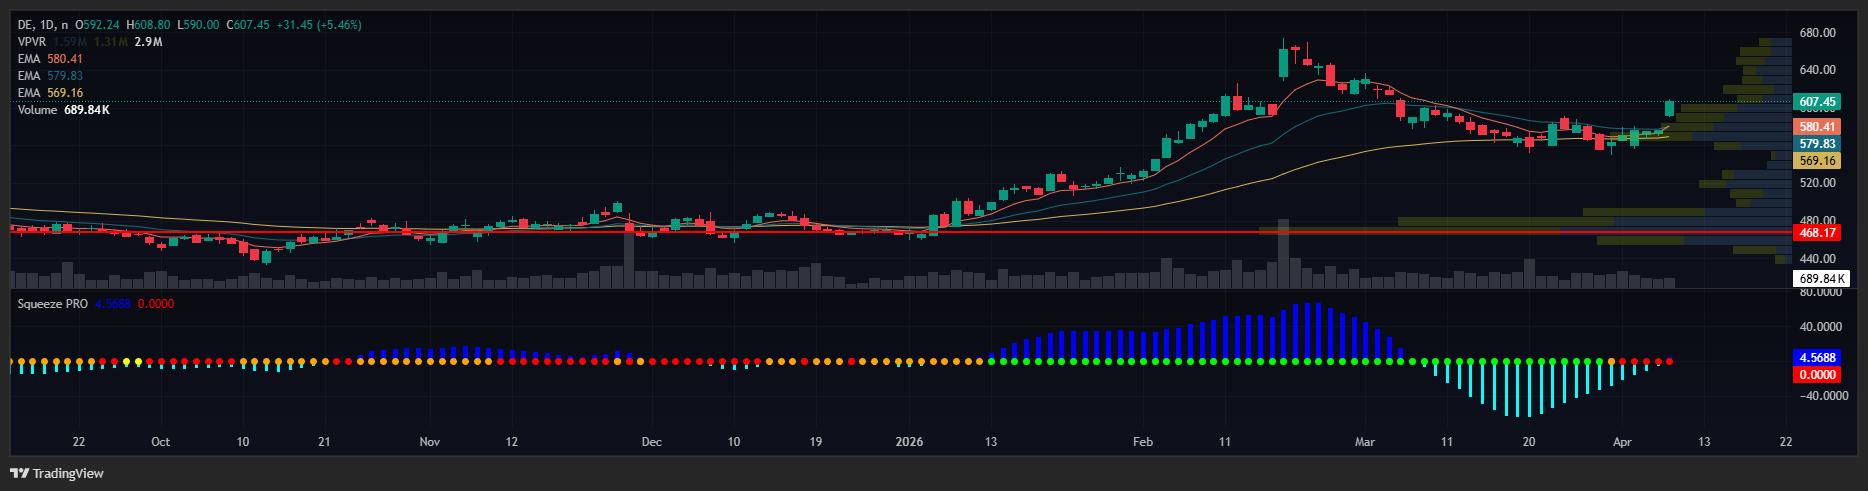
When fundamentals turn before mainstream notices, the chart catches it first. DE’s chart has been telling this story for weeks.
The 8-day EMA sits at $580. The 20-day EMA sits at $579. The 200-day SMA sits at $509. Yesterday, the price was around $608.
EMAs, or exponential moving averages, track a stock’s average closing price over a set period and give more weight to recent prices. When shorter EMAs sit above longer ones and all of them sit below the price, the trend is intact across every timeframe that matters.
The weekly EMAs are stacked, too. This trend has been building for months.
The Squeeze
After the February earnings gap, DE spent weeks compressing. The 8-day EMA and 20-day EMA pinched tight around $579-$580.
Price coiled above them. Volume dried up.
That is the squeeze. When price compresses between tightening moving averages, energy builds until it releases. When a squeeze fires on a stock with stacked EMAs and a strong fundamental story, that is the combination my system is designed to find.
The RSI read 62.
RSI, or Relative Strength Index, measures momentum on a scale of 0 to 100. Readings above 70 signal overbought. At 62, DE has room to run.
My system is called TPS — Trend, Pattern, Squeeze. I work through each step in order, and I do not enter until all three are confirmed and the trigger fires.
The setup is there, but given yesterday’s huge market move, I want to see how things play out today before making a decision.
Your Action Plan
Earnings winners with stacked EMAs and a fundamental catalyst behind them are exactly what I built Profit Surge Trader to find.
If you want to trade alongside that process, that is what Profit Surge Trader is for.
Learn more about Profit Surge Trader hereWant more content like this?
SPONSORED
Are you a long-term investor? You’ll Want to Hear This…
The President of the United States once went to bat for an American energy company that’s merging energy and AI.
It’s wildly cheap, and one man believes it could be the long-term answer to our AI energy needs.
Click here to unlock details on this value play.![]()
Monument Traders Alliance, LLC
You are receiving this email because you subscribed to Trade of the Day Wake-Up Watchlist.
To unsubscribe from Trade of the Day Wake-Up Watchlist, click here.
Questions? Check out our FAQs. Trying to reach us? Contact us here.
Please do not reply to this email as it goes to an unmonitored inbox.
To cancel by mail or for any other subscription issues, write us at:
Trade of the Day | 14 West Mount Vernon Place | Baltimore, MD 21201
North America: 800.507.1399 | International: +1.443.353.4977
Website | Privacy Policy
Keep the emails you value from falling into your spam folder. Whitelist Trade of the Day.
© 2026 Monument Traders Alliance, LLC | All Rights Reserved
Nothing published by Monument Traders Alliance should be considered personalized investment advice. Although our employees may answer your general customer service questions, they are not licensed under securities laws to address your particular investment situation. No communication by our employees to you should be deemed personalized investment advice. We allow the editors of our publications to recommend securities that they own themselves. However, our policy prohibits editors from exiting a personal trade while the recommendation to subscribers is open. In no circumstance may an editor sell a security before subscribers have a fair opportunity to exit. The length of time an editor must wait after subscribers have been advised to exit a play depends on the type of publication. All other employees and agents must wait 24 hours after publication before trading on a recommendation.
Any investments recommended by Monument Traders Alliance should be made only after consulting with your investment advisor and only after reviewing the prospectus or financial statements of the company.
Protected by copyright laws of the United States and international treaties. The information found on this website may only be used pursuant to the membership or subscription agreement and any reproduction, copying or redistribution (electronic or otherwise, including on the world wide web), in whole or in part, is strictly prohibited without the express written permission of Monument Traders Alliance, LLC, 14 West Mount Vernon Place, Baltimore, MD 21201.
REF: 000142349377
