Unsubscribe Something Bigger Than SpaceX is Coming (From TradeSmith)
Why Fastenal’s Latest Drop Could Be Its Biggest Opportunity Yet
Written by Thomas Hughes
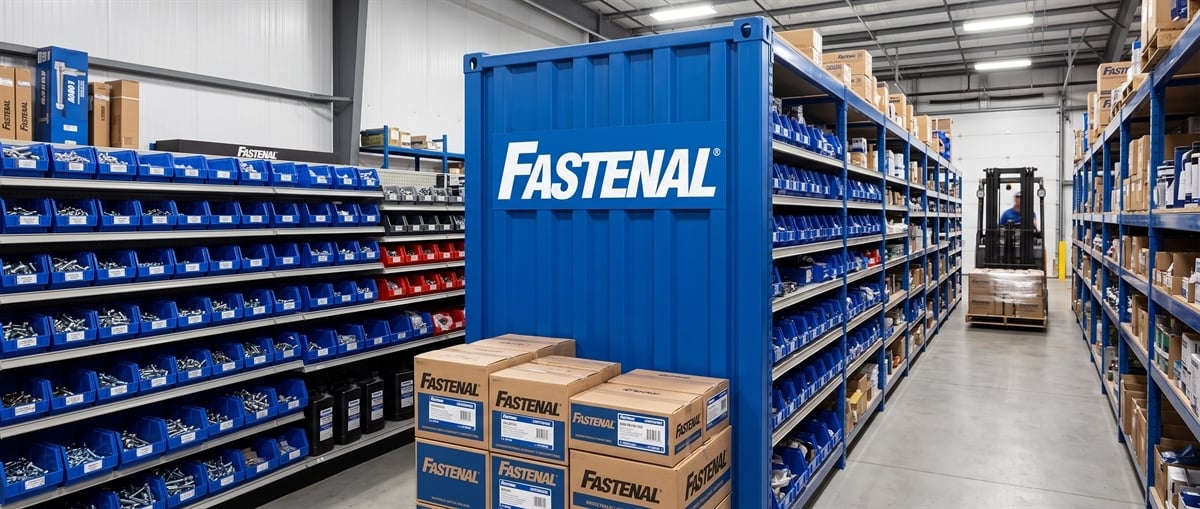
Fastenal’s (NASDAQ: FAST) stock price declined following its Q2 earnings release, creating another solid entry point for investors. The worst that can be said about the report is that earnings were only in alignment with the consensus forecast, providing no immediate impetus for bullish behavior.
However, “tepid” as the results may have been, the company revealed strengths investors like to own, including double-digit growth and strength across all segments, categories, and end markets, driven by new clients, client penetration, and digitization. Fastenal, among industrial suppliers, is uniquely positioned to benefit from digitization and AI, as it is a leader in technology-backed inventory management, providing effective solutions for businesses.
Fastenal Fires on All Cylinders: Persistent Strength Expected
Fastenal had a solid Q2 with revenue growing by nearly 15% on broad-based strength. Revenue outpaced MarketBeat’s reported consensus by a slim margin, underpinned by a 14.7% increase in daily sales. Strength was driven by market share gains linked to large-client penetration, with double-digit demand across product lines and end markets. The single area of weakness was the comparison between national-level and localized business, which grew at a 7.2% pace compared to the stronger 17.9% posted by the national-level business.
Margin news was also good, despite the relative weakness in bottom-line results. A slight contraction in gross margin was offset by SG&A leverage, leaving operating and net margins flat to slightly up year over year. Net income grew by 14.9%, enabling balance sheet improvement while investing and returning capital to investors. The capital return is the operational factor, as quarterly strength and business trends allowed management to accelerate buyback activity.
Fastenal is a healthy capital-returning machine. The company’s dividendyields about 2% with shares near the middle of a long-term trading range and is expected to grow annually. Share buybacks have a smaller, but still significant, impact on capital returns, offsetting the impact of share-based compensation, with higher levels expected in upcoming quarters. Q2 capital returns came in at nearly 80% of the net income, well above the long-running 69% average.
Fastenal’s balance sheet highlightsprovided no red flags for investors, only incentives for ownership. The company’s cash balance declined in Q2, but was offset by increases in assets, debt reduction, and equity improvements. Equity improved by more than 3% year-to-date, more than offsetting the incremental increase in the share count logged for the quarter. Looking ahead, investors can expect to see Fastenal’s balance sheet continue improving as it locks in market share and cash flow.
Sell-Side Data Reflects Strong Support for Fastenal
Sell-siders may have wanted more from the Fastenal Q2 release, but it was not sufficient to alter their stance, which reflects strong support. MarketBeat tracks 15 analysts rating the stock as a consensus Hold; there is a 33% Buy-side bias within the data, coverage is increasing, and price targets are steady. Forecasting only modest upside as of mid-July, analyst trends are positive and likely to continue supporting market action. Institutions, meanwhile, are accumulating aggressively, limiting downside risk.
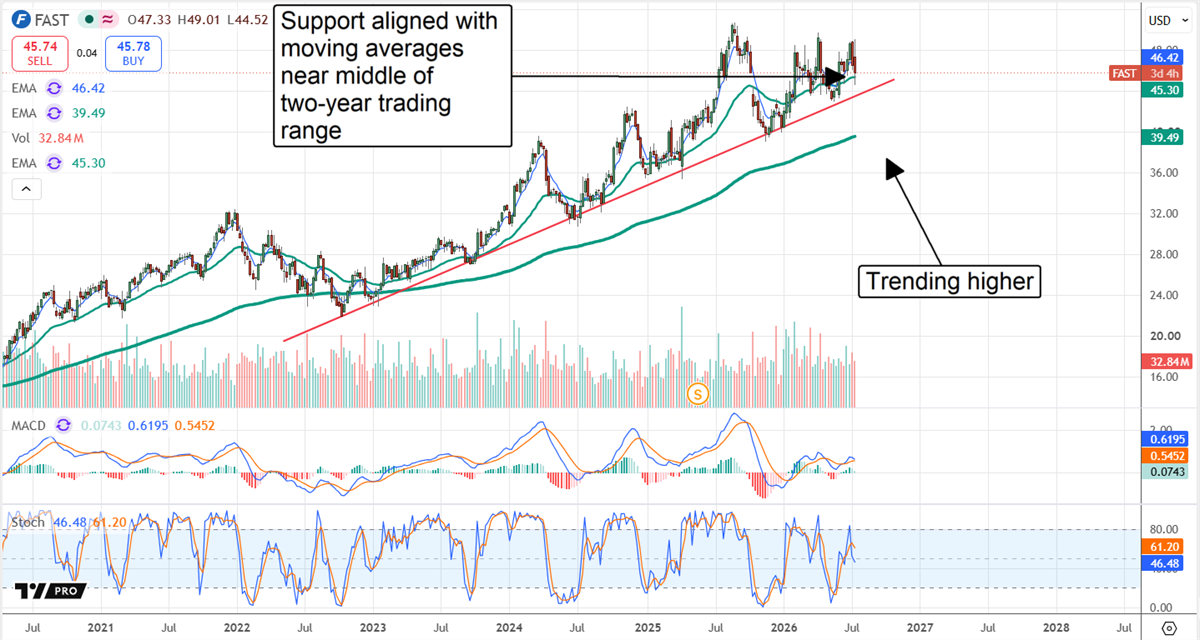
The stock price action also reflects strong, rising support, with the price trending higher over the past two years. The story in 2026 is that price action hit a ceiling in 2025 that will likely be retested before the year ends. The question is whether new highs will be set, and cash flow and capital returns suggest they will. Between then and now, the critical support is near a cluster of exponential moving averages (EMAs), including the 150-day EMA. It is a trigger likely to spur institutional investment when (if) reached.
Fastenal’s primary catalyst this year is the accelerating rollout of its digitized inventory management systems, FastBin and FastVend. They enable manufacturers, industries, and enterprises the ability to manage and control supply costs while providing Fastenal with visibility. Easing inflation is another catalyst, affecting the company’s margin and end-market demand. Assuming energy prices remain subdued, economic activity could pick up across the board.
What the market gets wrong about Fastenal is that its gross margin contractions are part of the overall strategy. The company is leaning hard into national contracted accounts that naturally have lower margins and expenses. Lower expenses are the critical factor, as reduced SG&A more than offsets the decline in gross margin. Meanwhile, the company is becoming entrenched in the end-market ecosystems, a fractured end-market at that, with its FastBin and FastVend systems, establishing a wide moat that competitors will not be able to cross. More importantly, localized vendors are unable to match Fastenal’s scale and digital capabilities, which enable it to gain share across the entire business cycle. READ THIS STORY ONLINE
Elon Musk’s Frightening $39T Warning (Ad)

The national debt just crossed $39 trillion, and Elon Musk – former head of the Department of Government Efficiency under President Trump – has gone on record saying the U.S. is ‘1,000% going to go bankrupt’ if the trajectory doesn’t change.
The Trump administration preserved a little-known IRS loophole that allows everyday Americans to shield their retirement savings from the next wave of market turbulence. A free 2026 Wealth Protection Guide walks through the steps to use it.DOWNLOAD YOUR FREE 2026 WEALTH PROTECTION GUIDE AND SECURE YOUR NEST EGG
3 Overlooked Energy ETFs Delivering Strong Returns and Income
Written by Nathan Reiff

Midstream energy firms—those companies overseeing the transportation, storage, and some processing of oil and gas—remain an essential but often overlooked part of the energy ecosystem. Because these companies often operate like toll roads, in that they get paid whenever energy moves through their system, they can be vital sources of stability for investors.
At the same time, their essential nature (oil and gas wouldn’t reach refineries without them) means this category of company is likely to weather any number of market storms.
The other benefits of midstream firms, including their propensity for strong dividends, stable cash flow, ability to protect against inflation, and high barriers to entry that help ensure controlled competition, make these companies attractive for many different types of portfolios. Investors can build exposure to midstream firms easily with the exchange-traded funds (ETFs) below.
A Narrow MLP Fund With Impressive Results
The Alerian MLP ETF (NYSEARCA: AMLP) offers exposure to an index of energy infrastructure Master Limited Partnerships (MLPs) operating within the midstream segment of the sector. The index is a capped, float-adjusted, market cap-weighted group of MLPs, and it yields a fund with just 16 positions. The largest names in AMLP’s portfolio, including major firms like Sunoco (NYSE: SUN) and Energy Transfer (NYSE: ET), have sizable allocations of about 13% or more.
MLPs are partnerships that require regular distributions and may come with some tax advantages compared to other corporate structures.
If these companies avoid corporate-level taxes due to their pass-through entity status, it’s a benefit to investors as well. This has played out so far this year, as AMLP has provided market-beating returns of 14% while also paying a sizable dividend yield of 7.5%.
For this stability and the benefit of both strong returns and passive income, investors must pay a hefty fee of 1.01% annually.
Still, the fund’s strong asset base and trading volume indicate that this is not an overwhelming concern for many investors.
A Low-Cost Alternative, But Beware Liquidity Concerns
A more diversified fund but with substantially lower assets and trading volume, the Alerian Energy Infrastructure ETF (NYSEARCA: ENFR) takes a different approach to the midstream category. This fund targets an index of midstream energy firms operating in the North American energy infrastructure business. Its 30 holdingsoverlap with AMLP above, so despite the difference in focus, these funds are unlikely to be a good complement to one another in the same portfolio.
Having a broader basket of stocks means that ENFR is not quite so heavily concentrated in individual names, but the biggest positions do get up to 8% or more of the portfolio.
One key advantage that ENFR has over AMLP and some other funds in this space is its expense ratio, which is substantially lower at 0.35%. As a trade-off, however, investors may face liquidity issues due to limited investor attention to this fund.
ENFR has also had a very strong start to 2026, returning 26% year-to-date (YTD) with a dividend yield of 3.9%.
Another Take on an MLP Approach
Investors uniquely interested in the MLP approach to midstream energy will find an alternative to AMLP in the Global X MLP & Energy Infrastructure ETF (NYSEARCA: MLPX). This ETF takes a unique approach in that it only offers limited direct exposure to MLPs themselves, instead choosing to focus on general partners of MLPs as well as other energy infrastructure firms in order to avoid fund-level taxes.
This fund lies in between the others above in terms of its cost, with an expense ratio of 0.45%, and also with regard to assets and trading volume. Like ENFR, it has 31 holdings and a U.S. focus, with the largest positions accounting for about 9% of assets. In terms of performance, MLPX is right up alongside ENFR, having returned about 25% YTD. It also has appeal as a passive income play thanks to its dividend yield of 4%.
Each of the three funds above has solidly outperformed the S&P 500 so far this year while also providing compelling distributions. In a different energy sector environment, this performance level may not be quite as impressive, but the underlying companies in these funds should continue to provide stable income regardless. Further, their vital role in the energy space helps to protect them—and their investors—even in the face of inflation, geopolitical turmoil, and other issues. READ THIS STORY ONLINE
Something Bigger Than SpaceX is Coming (Ad)

Log Into Keith’s $5,000 “Forecast Calendar”
An online calendar that shows you when the biggest stock jumps could occur this year – to the DAY – with 83% backtested accuracy. This year, it’s crushed the market by 115%. See how it works right now – on 5,000 stocks.UNTIL JULY 16, YOU CAN CLAIM FREE ACCESS HERE (NO PURCHASE NEEDED).
3 Space Stocks That Could Outshine SpaceX After Its IPO
Written by Chris Markoch

It’s been about one month since SpaceX’s (NASDAQ: SPCX) initial public offering (IPO), and the stock is down approximately 11% from its first trade on June 12. But cynics shouldn’t take a victory lap quite yet.
Some of the pullback is due to a simple, mechanical reason. There are a massive number of shares outstanding that haven’t been soaked up by institutional investors. Plus, IPOs have a track record of “underperforming” after their debut.
Taking a step back, this isn’t a repudiation of the overall space thesis. As of July 14, SpaceX’s market cap is $1.85 trillion. That’s down from the $2.1 trillion market cap at its debut, but it’s a strong signal that investors expect future growth in this sector.
A better explanation for the SPCX pullback may be that some of the capital and attention that had moved away from smaller space companies is returning. Many of these companies are working with SpaceX and rely on multi-year government and telecommunications contracts.
For investors looking for opportunities outside SPCX, here are three names to consider, along with the key objective each company aims to achieve.
Rocket Lab: More Than Just Rocket Launches
Rocket Lab (NASDAQ: RKLB) investors are quick to note that the company’s business model relies on more than rocket launches. That shows up in the company’s topline, where Space Services is now the company’s largest revenue contributor. This high-margin business will be good for the company’s bottom line and got a boost from its $8 billion acquisition of Iridium Communications.
However, as of the company’s Q1 2026 earnings report, Rocket Lab is not profitable on a GAAP or non-GAAP basis. That’s a key reason RKLB is down approximately 21% over the 30 days ending July 13, despite being added to the NASDAQ-100 index.
The company needs a catalyst, and that’s likely to come from the launch business. Rocket Lab is scheduled to launch its Neutron reusable rocket in late 2026. The medium-lift rocket will allow Rocket Lab to compete with SpaceX for larger payloads and constellation contracts. To that end, Rocket Lab has already signed contracts for five dedicated Neutron missions alongside 31 new Electron and HASTE bookings.
The largest concern is valuation. Even after the pullback, RKLB trades around 72x sales. A company like Rocket Lab will command a higher multiple, and analysts give the stock a consensus price target of $111.88, an upside of over 38% from its price on July 14. Execution risks exist, but the upside shouldn’t be dismissed.
AST SpaceMobile: A Long Game That’s Starting to Pay Off
AST SpaceMobile (NASDAQ: ASTS) is developing a space-based cellular broadband network designed to connect standard mobile phones and other devices directly to satellites. It’s the definition of playing the long game, but so far, it’s paying off.
In its Q1 2026 earnings report, the company said it was on track to achieve its full-year revenue guidance between $150 million and $200 million.
This is driven by mobile network partners with Verizon Communications (NYSE: VZ) and AT&T (NYSE: T), as well as the U.S. Government. AST SpaceMobile is targeting roughly 45 BlueBird satellites to be in orbit by year-end.
Analysts are forecasting even stronger revenue growth over the next two years, with the company expected to turn a profit in 2028.
But at the moment, investors have to account for the company’s significant cash burn. That doesn’t make ASTS uninvestable, but it also means that volatility should be expected.
Intuitive Machines: The Space Stock With the Clearest Path to Profits
The common denominator for space companies, including SpaceX, is that they are not yet profitable. However, Intuitive Machines (NASDAQ: LUNR) may have the clearest line of sight to profitability.
In the company’s Q1 2026 earnings report, it guided to approximately $1 billion in full-year 2026 revenue and ended the quarter with a backlog of around $1.1 billion. NASA is the company’s key customer as Intuitive Machines is aligned with the Artemis program. That will take the company’s revenue pipeline into the next decade.
That said, among the three companies on this list, Intuitive Machines may pose the greatest operational risk. Lunar missions are often delayed, and the stock prices of companies linked to those delays can be affected. But after a pullback of approximately 35% in the three months ending July 13, investors will find it difficult to ignore the analysts who give LUNR a consensus price target of $31.50, a 105% gain.
Time Works for Patient Investors
Many retail investors rushed into the space sector, believing these stocks were going to the moon. That’s not an incorrect assumption, but the timing will be choppy. There will be some failures along the way, and this is a capital-intensive business with many companies, including SpaceX, that are not yet profitable.
All of which means that timing and position size are critical. Committing capital across market cycles, rather than trying to time tops and bottoms, is likely to be a winning strategy. The space economy is real and growing. But it will still require patience. READ THIS STORY ONLINE
BlackRock is hoarding it. JPMorgan is hoarding it. Do you own it? (Ad)

BlackRock, JPMorgan, Goldman Sachs, and Fidelity are reportedly accumulating a scarce blockchain asset – one that gets burned with every transaction on what analysts are calling America’s new financial grid.
The Nasdaq has received SEC approval to move stocks onto blockchain rails, and BlackRock CEO Larry Fink dedicated his entire 2026 annual letter to this infrastructure shift. Blockchain analyst Andy Howard is calling this asset ‘Digital Oil’ – and says institutional buyers are already positioned.GET THE NAME, THE TICKER, AND EXACTLY HOW TO BUY IT
More Stories
- The SK Hynix IPO and 2027’s AI Memory Squeeze
- The Bond Market Just Sent Amazon a Message Investors Shouldn’t Ignore
- Elon did what?! (Ad)
- Wedbush Pounds the Table—Buy Sandisk Before August 5 Earnings
- CEOs Sell Millions Worth of These 3 Big Name Stocks—What It Means for Investors
- Beyond the Foundry: 5 Infrastructure Stocks Tackling the AI Bottlenecks
- No Space For Panic: T-Mobile Shrugs Off The Starlink Threat
The Night Owl is a financial newsletter that provides in-depth market analysis on stocks of interest to individual investors. Published by MarketBeat and Early Bird Publishing, The Night Owl is delivered around 9:00 PM Eastern Sunday through Thursday. If you give a hoot about the market, The Night Owl is the newsletter for you.

If you have questions or concerns about your newsletter, please don’t hesitate to email MarketBeat’s U.S. based support team at contact@marketbeat.com.
Unsubscribe
Copyright 2006-2026 MarketBeat Media, LLC.
345 North Reid Place, Sixth Floor, Sioux Falls, SD 57103-7078. U.S.A..
Featured Link: Tracking institutional buy orders before the crowd catches on (Click to Opt-In)


