You have signed up to receive emails from todaysflashback.com and agreed to receive our daily newsletters which include promotions. Content labeled as “SPONSORED” may be a third-party advertisement and is not endorsed or warranted by any individual or company as a whole.
Is your Social Security and Medicare strategy built for today’s retirement?
For years, the conventional wisdom on Social Security was simple: wait until 70 to maximize your benefit, pick a Medicare plan at 65, and revisit it occasionally.
But the retirement landscape in 2026 looks different. Longer life expectancies, rising healthcare costs, and a flood of conflicting advice from financial media have made these decisions feel far more complicated—and the stakes far higher.
That’s why we’re offering our free guide1 to help you navigate Social Security and Medicare with clarity, not guesswork. You’ll learn:
Why the “claim at 62 vs.70” Social Security debate misses the point
How to think through the claiming decision based on your specific situation
A breakdown of Medicare’s structure and your main coverage options
The Medicare trends retirees should know in 2026
Plus, how both these decisions fit into a broader retirement income and investment strategy
Talk to a Zacks Wealth Advisor today.
1 Zacks Investment Management reserves the right to amend the terms or rescind the free Looking To Retire In 2026? Your Guide to Social Security and Medicare Decisions That Matter offer at any time and for any reason at its discretion.
Past performance is no guarantee of future results. Inherent in any investment is the potential for loss. Zacks Investment Management, Inc. is a wholly-owned subsidiary of Zacks Investment Research. Zacks Investment Management is an independent Registered Investment Advisory firm and acts as an investment manager for individuals and institutions. Zacks Investment Research is a provider of earnings data and other financial data to institutions and to individuals.
This material is being provided for informational purposes only and nothing herein constitutes investment, legal, accounting, or tax advice, or a recommendation to buy, sell or hold a security. Do not act or rely upon the information and opinions given in this document without seeking the services of competent and professional investment, legal, tax, or accounting counsel. Publication and distribution of this document is not intended to create, and the information and opinions contained herein does not constitute, an attorney-client relationship. No recommendation or advice is being given as to whether any investment or strategy is suitable for a particular investor. It should not be assumed that any investments in securities, companies, sectors, or markets identified and described were or will be profitable. All information is current as of the date of herein and is subject to change without notice. Any views or opinions expressed may not reflect those of the firm as a whole.
Any projections, targets, or estimates in this document are forward looking statements and are based on the firm’s research, analysis, and assumptions. Due to rapidly changing market conditions and the complexity of investment decisions, supplemental information and other sources may be required to make informed investment decisions based on your individual investment objectives and suitability specifications. All expressions of opinions are subject to change without notice. Recipients should seek financial advice regarding the appropriateness of investing in any security or investment strategy discussed in this document.
Certain economic and market information contained herein has been obtained from published sources prepared by other parties. Zacks Investment Management does not assume any responsibility for the accuracy or completeness of such information. Further, no third party has assumed responsibility for independently verifying the information contained herein and accordingly no such persons make any representations with respect to the accuracy, completeness or reasonableness of the information provided herein. Unless otherwise indicated, market analysis and conclusions are based upon opinions or assumptions that Zacks Investment Management considers to be reasonable.
Any investment inherently involves a high degree of risk, beyond any specific risks discussed herein.
It is not possible to invest directly in an index. Investors pursuing a strategy similar to an index may experience higher or lower returns, which will be reduced by fees and expenses.
Adam O’Dell Chief Investment Strategist, Money & Markets
Special Report
After Cooling Off, On Holding May Be Ready to Sprint Higher
Reported by Thomas Hughes. Article Posted: 3/6/2026.
Key Points
On Holding’s Q4 2025 results showed strong, broad-based growth across channels, categories, and regions.
Fiscal 2026 guidance came in light, but analysts largely view it as conservative and still expect outperformance.
Analyst sentiment and institutional activity suggest support near key technical levels and potential upside.
Special Report: [Sponsorship-Ad-6-Format3]
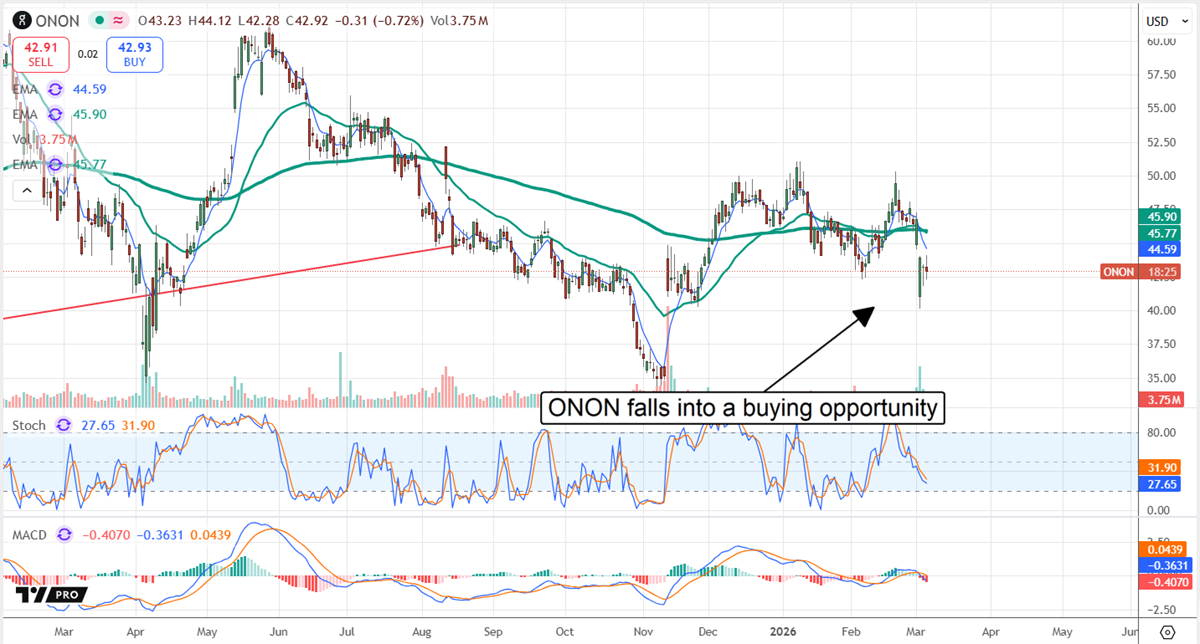
On Holding’s (NYSE: ONON) share price has struggled amid fears of slowing growth, valuation concerns, and the impact of tariffs, but the selling appears to be abating. Q4 2025 results were strong, with growth holding up across channels and categories. While 2026 guidance fell short of consensus, the company is forecasting another solid year and analysts expect outperformance.
The analysts’ response suggests the guidance miss may have been deliberate; On Holding often sets conservative targets and then exceeds them. The company expects to sustain a roughly 20%+ growth pace in the coming year, driven by strengths across segments and retail categories.
Data from MarketBeat shows coverage rising and sentiment firming: 25 analysts cover the stock and there is an 84% buy-side bias toward the Moderate Buy rating. The price target remains bullish and steady despite the March revisions, implying roughly 40% upside from a key support level. That critical support target is the long-term exponential moving average near $41.30, where the stock has found support in prior periods.
Support is also visible in analysts’ trends and institutional activity. Coverage, price targets and institutional holdings have all trended higher. Institutions accumulated ONON shares in three of four quarters in 2025 and in the first two months of Q1 2026, ramping activity to record levels even as the price retreated. That accumulation points to a solid base and a tailwind that could drive the stock higher over time. The main question is timing — and the rebound could begin before mid-year. If guidance proves conservative, the next visible catalyst is Q1 2026 earnings in mid-May.
On Holding Tanks on Robust Results and Growth Outlook
On Holding’s Q4 was as solid as they come, with revenue rising about 34%, slightly ahead of consensus. Strength came from a 31% increase in wholesale and a 30% rise in higher-margin direct-to-consumer (DTC) sales, supported by 21% growth in core shoes, 38% in apparel and 117% in accessories. Regionally, Asia-Pacific (APAC) led with an 85% increase, followed by a 21.3% gain in the Americas and a modest 2.5% rise in EMEA (Europe, Middle East & Africa).
The margin story is mixed but ultimately constructive. Net income margin declined more than expected due to aggressive investment and foreign-exchange (FX) headwinds, but that was offset by record gross margins and a 31.8% increase in EBITDA. The stock weakness in early March stemmed from guidance that missed expectations, which stoked fears of slowing growth and margin pressure in the retail space.
On Holding Builds Value for Investors
There are no red flags on On Holding’s balance sheet. The company is well-capitalized and holds net cash versus debt. Shareholder equity rose about 17% in 2025 and is expected to continue increasing. On Holding has prioritized reinvesting in growth rather than returning capital to shareholders, but it appears on track to return capital in coming years.
Key catalysts for 2026 include strong apparel sales that support durable revenue and margins, continued focus on DTC channels, and improving brand awareness. On engages top athletes and leverages its premium positioning to tell targeted stories that motivate consumers. DTC is a double-edged sword — it can boost growth and margins while risking friction with wholesale partners, as Nike’s experience illustrates. Other risks include FX headwinds and the potential for slowing growth.
Price action has been mixed since the release. The report triggered a sharp sell-off that, in turn, spurred buying. Since then, the stock has met resistance near the short-term 30-day exponential moving average (EMA), which could cap near-term gains. Over the longer term, ONON looks positioned to rebound and could accelerate higher once the recovery starts.
Just For You
The Copper Shortage Is Coming—These 3 Miners Are Ready
Author: Chris Markoch. Published: 3/8/2026.
Key Points
Aging global copper mines and rising electrification demand could create a structural copper supply shortage.
Small-cap miners with operating assets or near-term projects may benefit most from rising copper prices.
Taseko Mines, Talon Metals, and Arizona Sonoran Copper offer different ways for investors to gain exposure.
Special Report: [Sponsorship-Ad-6-Format3]
Fear sells. But a headline about a copper shortage should excite investors, not frighten them—especially those with a long-term outlook on basic materials stocks, including mining companies. The advancing age of many copper mines strengthens the case for several small-cap copper miners.
Copper mines, no matter how productive, have finite lives. Many of the world’s largest mines are also among the oldest. That doesn’t mean they will stop producing, but each will generally yield less copper per ton of ore moved.
Our investment research analysts are going to be releasing their next investment idea tomorrow morning, around 10:00 AM Eastern time.Add yourself to the distribution list here.
That looming supply shortfall is occurring at the same time the world needs more copper, not less. That mismatch is where opportunities can emerge for small-cap miners.
Even under a friendly administration, permitting and building new mines is difficult, costly and time-consuming. That gives companies with existing operations or near-term projects a built-in advantage—one that can lead to rising asset valuations.
Small-cap stocks have been out of favor, but that may change as investors search for growth in a lower-rate environment. Here are three names to consider.
Taseko Mines Expands Production in Tier-1 Jurisdictions
First up is Taseko Mines Ltd. (NYSEAMERICAN: TGB), a Vancouver-based Canadian miner. The company already operates the Gibraltar project in British Columbia, one of Canada’s largest open-pit copper producers. Taseko is guiding for output of 110–115 million pounds in 2026, up from roughly 99 million pounds in 2025.
Adding to the bullish outlook, Taseko has started copper production at its Florence in-situ project in Arizona, another Tier-1 jurisdiction. On March 2, the company announced it had harvested its first copper cathodes from the Florence project—the first new copper production from a greenfield facility in the United States since 2008.
Management expects Gibraltar’s higher-grade Connector pit to deliver stable production through at least 2029. If that holds, it should give the company time to ramp up Florence, enhancing Taseko’s long-term appeal.
TGB stock recently closed near $7.50, above the consensus price target of roughly $5, though that target is based on just two analysts. Institutional ownership is low but has increased over the last two quarters. If Taseko meets its production goals, analysts will likely revise their targets upward.
Talon Metals Offers High-Risk, High-Reward Potential
Talon also operates the Eagle Mine and Humboldt Mill in Michigan, currently the only nickel mine in the United States, linking the company to the battery and EV supply chain. The company secured an extension from Rio Tinto’s Kennecott subsidiary to complete a feasibility study and additional spending to earn up to 60% ownership, with a key environmental review milestone expected in the first half of 2026.
TLOFF stock has been an incredible performer, gaining more than 990% over the last 12 months. It’s also up over 45% in 2026. The stock recently closed near $6.25, about 6.5% above the consensus price target of roughly $5.84.
Arizona Sonoran’s Acquisition Highlights Copper Value
Arizona Sonoran controls 100% of the brownfield Cactus copper project in Arizona. The acquisition will give Hudbay full control of the Cactus project.
Combined with Hudbay’s Copper World asset, the deal will create the third-largest copper district in North America and establish a major hub for U.S. copper production. Cactus could add roughly 103,000 tonnes of annual copper production once developed, with proven and probable reserves of 5.3 billion pounds of copper over a 20-year mine life.
Boards of both companies have approved the agreement, which is expected to close in the second quarter of this year. That may discourage direct investment in ASCUF shares today, but once the deal is finalized each ASCUF share will be exchanged for 0.242 common shares of HBM stock.
Thank you for subscribing to DividendStocks.com’s daily newsletter for dividend and income investors that covers ex-dividend stocks, new dividend declarations, dividend stock ideas, and the latest market news.
This email communication is a sponsored message provided by Banyan Hill Publishing, a third-party advertiser of DividendStocks.comand MarketBeat.
If you would like to unsubscribe from receiving offers for Strategic Fortunes, please click here.
If you have questions or concerns about your newsletter, don’t hesitate to contact our U.S. based support team at contact@marketbeat.com.
If you no longer wish to receive email from DividendStocks.com, you can unsubscribe.
Copyright 2006-2026 MarketBeat Media, LLC. 345 N Reid Pl. #620, Sioux Falls, South Dakota 57103-7078. USA..
Meta and Rocket Lab Insiders Sell Shares—So Why Is Wall Street Buying?
Reported by Jeffrey Neal Johnson. Article Published: 3/3/2026.
Key Points
Institutional investors continue to pour capital into Meta Platforms and Rocket Lab despite high-profile insider selling by executives.
Meta Platforms continues to demonstrate operational efficiency with strong revenue growth and healthy profit margins that attract smart money.
Rocket Lab maintains a massive backlog of government contracts, which provides long-term revenue visibility and stability for shareholders.
Special Report: [Sponsorship-Ad-6-Format3]
It’s a confusing time for retail investors. Markets are trading near record highs, companies are reporting massive revenue gains, and excitement around technology and space exploration is palpable. Yet a troubling trend has emerged in the headlines: the people running these successful companies — CEOs, CFOs, and COOs — are selling stock at an aggressive pace.
When executives sell millions of dollars worth of shares, alarm bells naturally ring. Investors worry the insiders know something the public does not. Is the top in? Are growth prospects slowing? Watching a chief financial officer dump stock can feel like seeing the captain put on a life vest while assuring passengers the ship is unsinkable.
Our investment research analysts are going to be releasing their next investment idea tomorrow morning, around 10:00 AM Eastern time.Add yourself to the distribution list here.
But panic is rarely a profitable strategy. While insider selling creates fear, a deeper look at the data often reveals a counter-signal: institutional accumulation. Hedge funds, pension funds, and investment banks frequently buy the same shares executives are selling. This divergence between individual profit-taking and institutional conviction can offer opportunities for investors who know where to look.
Zuckerberg’s Team Cashes Out, But Wall Street Buys In
Meta Platforms (NASDAQ: META) has been a dominant market force, with its stock trading around $655 as of early March 2026. That level represents a significant rally from prior years, driven by the integration of artificial intelligenceand robust advertising revenue.
Recent filings show Meta’s executives taking substantial chips off the table. In Feb. 2026 alone, CFO Susan Li sold roughly $35 million of stock, and COO Javier Olivan executed multiple sell orders throughout the month. In total, eight insiders have sold over the past 12 months, with no insider buys recorded. To an outsider, seeing senior leadership reduce holdings can look like a lack of confidence.
Understanding Rule 10b5-1 Trading Plans
It’s important to understand how these trades are often executed. Many of the sales occurred under Rule 10b5-1 trading plans — pre-scheduled arrangements that automatically sell stock at set times or prices and are typically established months in advance.
Legal protection: These plans shield executives from insider trading allegations. They can’t simply decide to sell based on nonpublic information because the sale schedule was likely set well before any recent developments.
Diversification: Executives are frequently paid in stock. Selling is the only practical way to convert that paper wealth into cash for taxes, real estate, or portfolio diversification.
Rational behavior: With the stock near all-time highs, locking in gains is a normal part of financial planning and does not necessarily signal a bearish outlook on the company’s future.
Institutions are focusing on fundamentals rather than the optics of insider trades:
Earnings beat: In late Jan. 2026, Meta reported earnings per share (EPS) of $8.88, well above estimates of $8.16.
Revenue growth: Revenue rose 23.8% year-over-year, showing that the company’s core advertising engine is accelerating.
Margins: Despite heavy AI infrastructure spending, Meta maintained net margins above 30%, indicating operational efficiency.
Valuation: Trading at a price-to-earnings ratio (P/E) near 27.90, Meta’s valuation is reasonable for a company growing revenue at over 20%.
For Meta’s institutional investors, the thesis is straightforward: Meta is a cash-flow machine with a dominant position, and the current price looks like a stepping stone to higher valuations rather than an endpoint.
Blast Off: Why Institutions Are Chasing a Space Stock
The insider selling versus institutional buying dynamic is even more pronounced at Rocket Lab USA (NASDAQ: RKLB). The aerospace company saw its stock surge from the mid-teens to over $70 in a year, creating sizable liquidity events for leadership.
In Dec. 2025, CEO Peter Beck sold more than $140 million in stock, and CFO Adam Spice sold over $100 million in Jan. 2026. Those are large figures that can spook retail investors.
Context matters. Rocket Lab’s leadership spent years building the company from a startup to a $37 billion industry player. For founders and early executives, selling after a roughly 400% run-upcan be a life-changing financial event. It often reflects the realization of past success rather than a loss of faith in the company’s future — if they thought the company was doomed, they likely would have sold much earlier at lower prices.
Why Wall Street Loves Rocket Lab
Wall Street clearly doesn’t view these insider sales as a red flag. Institutional ownership in Rocket Lab has climbed to nearly 72%. Over the past 12 months, institutions bought $4.96 billion in shares while selling only $1.51 billion. Major funds like Vanguard and Baillie Gifford are absorbing much of the supply created by insiders.
Institutions are buying based on three key catalysts:
Massive backlog: Rocket Lab sits on a $1.85 billion backlog, providing multi-year revenue visibility. Much of this work comes from the Space Development Agency (SDA), so revenue is supported by government contracts.
Record revenue: The company closed 2025 with record revenue of $602 million, validating its business model.
Strategic position: Rocket Lab has effectively cornered the small-to-medium launch market outside of SpaceX.
Even the recent Neutron rocket delay to Q4 2026 — caused by a manufacturing defect in a tank test — hasn’t stopped accumulation. Analysts view the delay as a temporary setback. The size of the SDA contracts and the company’s satellite production capabilities keep the long-term growth narrative intact.
The Bigger Picture: Wealth Transfer
When evaluating names like Meta Platforms and Rocket Lab, it’s easy to get swept up in dramatic headlines. Insider selling makes for attention-grabbing stories, but it rarely tells the whole picture. Executives sell for personal reasons; institutions buy for profit.
The divergence we see today is a classic case of wealth transfer: insiders are cashing out on a decade of growth, while institutions position for the next decade.
Actionable takeaways:
Meta Platforms: The “AI fatigue” narrative appears to be mostly noise. Strong institutional support suggests the stock remains appropriate for long-term portfolios.
Rocket Lab: The large backlog and the company’s dominant position in the space economy outweigh the optics of insider selling. Institutional accumulation implies the Neutron delay may be a buying opportunity rather than a reason to exit.
Ultimately, while insiders may be taking profits, the market’s largest players are betting heavily that the rally is far from over. Following the flow of institutional capital often provides a clearer signal of value than reading into the tax planning or diversification decisions of a few executives.
Investors seeking long-term growth may want to keep Meta Platforms on their watchlist for potential dips caused by insider-selling headlines, while aggressive growth investors might view Rocket Lab’s pullback as an entry point given the strong institutional support and $1.85 billion backlog.
More Reading from MarketBeat
ZIM’s $35 Buyout: An Arbitrage Play With a Solid Floor
Written by Jeffrey Neal Johnson. Publication Date: 3/9/2026.
Key Points
The company demonstrated significant operational strength by posting a surprise profit despite challenging market conditions.
A pending all-cash acquisition by a major shipping line has created a clear and significant valuation gap for the company’s shares.
The deal includes a well-defined plan to secure regulatory approval, increasing the likelihood of a successful transaction completion.
Special Report: [Sponsorship-Ad-6-Format3]
In a global shipping industry defined by geopolitical crosscurrents and economic uncertainty, identifying value requires focusing on companies that demonstrate operational resilience and clear catalysts. While market volatility has kept many investors on the sidelines, ZIM Integrated Shipping Services Ltd. (NYSE: ZIM) has emerged with a compelling case.
ZIM recently navigated a challenging market to post a surprise fourth-quarter profit, underscoring a healthy business model. More significantly, ZIM is at the center of a multibillion-dollar acquisition that creates a sizeable valuation gap, presenting a noteworthy situation for investors watching the transportation and logistics sector.
Our investment research analysts are going to be releasing their next investment idea tomorrow morning, around 10:00 AM Eastern time.Add yourself to the distribution list here.
A company’s ability to generate profit during market normalization is a strong indicator of fundamental health. For the fourth quarter of 2025, ZIM delivered an earnings surprise that defied expectations. ZIM reported a net profit of $0.32 per share versus the consensus analyst estimate of a $1.01 per share loss. This outperformance reflects ZIM’s strategic and operational discipline.
This bottom-line strength came even as record-high freight rates cooled. ZIM’s quarterly revenue was $1.48 billion, and the average freight rate per twenty-foot equivalent unit (TEU) settled at $1,333. Turning a profit in this environment points to a proactive operational strategy.
One key driver of this efficiency is ZIM’s fleet modernization program, which focuses on integrating newer, more cost-effective and fuel-efficient liquefied natural gas (LNG) vessels. These ships use cleaner fuel and are designed for greater efficiency, helping ZIM lower voyage costs and protect margins.
This operational strength is supported by a complex macro backdrop. Ongoing geopolitical tensions and disruptions in the Red Sea have forced many carriers to reroute vessels around the Cape of Good Hope. These longer transit times effectively absorb excess global shipping capacity, creating a functional floor for freight rates and preventing a market collapse.
ZIM’s performance shows its ability not only to withstand these headwinds but also to leverage its efficient fleet to benefit from resulting market stability. For investors, this proven profitability provides a solid fundamental backstop, reducing downside risk as ZIM moves toward the next major chapter in its corporate story.
A $35 Cash Buyout and the Valuation Gap
While ZIM’s operational health is impressive, the most significant catalyst shaping its investment profile is a pending acquisition by German shipping giant Hapag-Lloyd (OTCMKTS: HPGLY). On Feb. 16, 2026, the two companies announced a definitive agreement under which Hapag-Lloyd would acquire ZIM for $35 per share in an all-cash transaction. The deal values ZIM at roughly $4.2 billion and reframes its valuation for the foreseeable future. The move is expected to strengthen Hapag-Lloyd’s market position, particularly on trans-Pacific routes where ZIM is well represented.
This acquisition creates a classic merger arbitrage scenario. The strategy involves buying the stock of a company being acquired to profit from the spread between the current trading price and the acquisition price. With ZIM’s stocktrading around $28 per share, a clear valuation gap exists. If the deal closes as planned, this spread represents a potential upside of more than 20% from current levels. That potential return is tied to the successful completion of the transaction rather than future freight rates or earnings.
As an additional return, ZIM has declared a fourth-quarter dividend of $0.88 per share, payable to shareholders of record in late March 2026. ZIM has not yet declared an ex-dividend date for the quarter. Investors should note the merger agreement restricts future special dividend distributions, putting the primary focus on the $35 acquisition price as the main driver of shareholder returns.
In effect, the buyout offer acts as a strong magnet for the stock price. The central question for investors is no longer the direction of the shipping market, but the likelihood that the acquisition will close.
A Clear Path to Merger Completion
In any cross-border acquisition, regulatory approval is a critical checkpoint. For the Hapag-Lloyd–ZIM merger, the most significant issue involves the Golden Share held by the State of Israel. Israel relies heavily on maritime trade for economic stability and national security, and the Golden Share gives the government special rights to protect strategic shipping interests and vital supply chains.
Rather than leaving this as a potential deal breaker, the companies built a proactive solution into the agreement. To secure regulatory approval and address Israel’s national security concerns, the deal includes formation of a new, independent Israeli entity called New ZIM. FIMI Opportunity Funds will acquire the Golden Share from the state and operate New ZIM, which will maintain a dedicated fleet of 16 modern vessels to service critical trade routes, ensuring Israel’s supply chain integrity remains intact after the acquisition.
Hapag-Lloyd has also committed to providing commercial support to New ZIM, facilitating a stable operational transition. This clear and functional structure was designed to satisfy regulatory requirements from the outset. By addressing the primary potential roadblock directly, the companies have materially increased the likelihood the deal will close, strengthening the case for the merger arbitrage opportunity.
Why ZIM Warrants Investor Attention
ZIM Integrated Shipping’s recent performance confirms its status as a resilient, efficient operator in a complex global market. The surprise fourth-quarter profit demonstrates a fundamental strength that underpins the company’s current valuation. That operational health is a de-risking factor as shareholders focus on the pending all-cash acquisition by Hapag-Lloyd. The structured plan to resolve Israeli regulatory concerns creates a clear path toward deal completion.
For investors, the situation presents a unique convergence of factors. The company’s proven profitability supports the investment thesis, while the fixed $35-per-share buyout offer provides a defined upside. Investors interested in merger arbitrage may find the current spread in ZIM shares compelling. The combination of a fixed-price cash buyout and solid underlying performance offers a well-defined risk-reward profile worth monitoring.
Thank you for subscribing to The Early Bird, MarketBeat’s 7:00 AMnewsletter that covers stories that will impact the stock market each day.
This email communication is a paid sponsorship from Trend Labs, a third-party advertiser of The Early Bird and MarketBeat.
If you have questions or concerns about your account, please don’t hesitate to contact our U.S. based support team at contact@marketbeat.com.
If you no longer wish to receive email from The Early Bird, you can unsubscribe.
Copyright 2006-2026 MarketBeat Media, LLC. All rights reserved. 345 N Reid Place, Sixth Floor, Sioux Falls, S.D. 57103-7078. USA..
Our investment research analysts are going to be releasing their next investment idea tomorrow morning, around 10:00 AM Eastern time.Add yourself to the distribution list here.
Follow-on contracts, new customers, improved execution, an expanding manufacturing footprint, and full compliance with the National Defense Authorization Act (NDAA) position the company well.
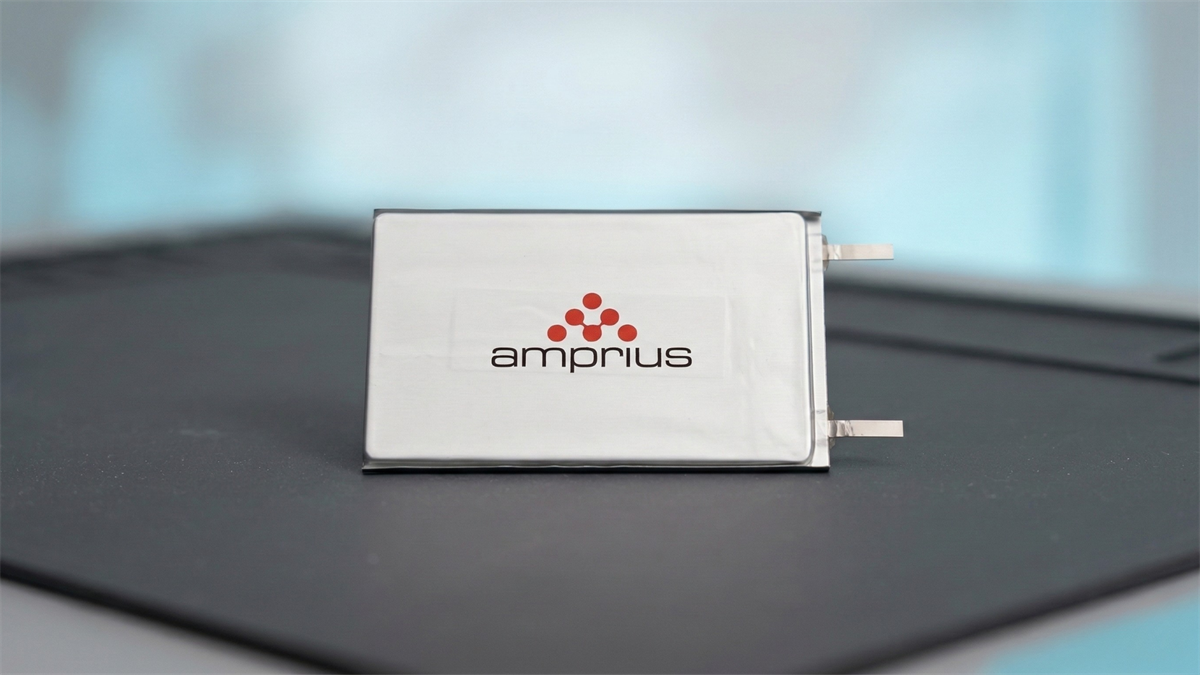
Other details included a one-time charge related to the discontinued lease of a Colorado facility. Originally intended to serve as Amprius’ manufacturing base, the company has since shifted to a contract manufacturing model for its advancedbatteries, relying on third-party manufacturers.
The one-time charge clarifies the company’s obligations and improves cash-flow visibility as it strengthens its outsourced manufacturing base. Three South Korean battery manufacturers and one U.S.-based manufacturer were recently added to the network, putting the company on track for full NDAA compliance and accelerating government business this year.
Amprius Accelerates its Profitability Outlook in 2026
Amprius Technologies reported an electrifying quarter: revenue rose more than 137% year-over-year (YOY), beating consensus by over 1,000 basis points (bps). Growth was driven by new and existing customers and strong execution, with client and contract wins pointing to continued momentum in 2026.
Another catalyst was margin improvement. Gross margin widened by 4,500 bps to 24% (positive), driving a 365% YOY increase in gross profit (also positive) and the company’s first quarter of positive adjusted EBITDA.
The company is still burning cash, but losses contracted sharply and are expected to improve in coming quarters. Analysts currently forecast an inflection to adjusted profits in Q1 2027, though it could occur by the end of 2026; management is guiding toward positive adjusted EBITDA.
Analysts Point to 60% Upside Potential and Long-Term Highs
Analysts have been slow to update estimates after Amprius’ Q4 results, but the bullish trends leading into the report are likely to strengthen in its wake.
Data show coverage increasing to nine analysts on a trailing-twelve-month (TTM) basis, sentiment firming to Moderate Buy with an 88% buy-side bias, and price targets rising.
The consensus price target implies more than 30% upside from the pre-release closing price, while the high-end range — set by Northland Securities last year and reaffirmed by Needham in January — suggests an additional ~25% upside is possible.
Institutional ownership offers another catalyst. Institutional interest remains light at roughly 5% as of early March, but the trend is strengthening. Institutional buying spiked in Q4 2025 and remained strong in Q1 2026, providing a tailwind for the stock.
This increase in ownership is noteworthy given the spike in short interest in late 2025 and early 2026, which set the market up for potential short-covering rallies or a short squeeze.
No Red Flags in AMPX’s Balance Sheet: Green Flags in Its Price Action
Amprius’ balance sheet shows no red flags. The company is well-capitalized, reports net cash relative to total liabilities, and increased shareholders’ equity in 2025. Equity grew by nearly 50%, leaving leverage at ultra-low levels and positioning the company to continue executing its strategy.
Looking ahead, the cash balance may decline in coming quarters, but additional capital raises appear unlikely at this point. Without the need to build its own manufacturing capacity, management can focus on development, marketing, and sales — another factor suggesting potential outperformance in the year ahead.
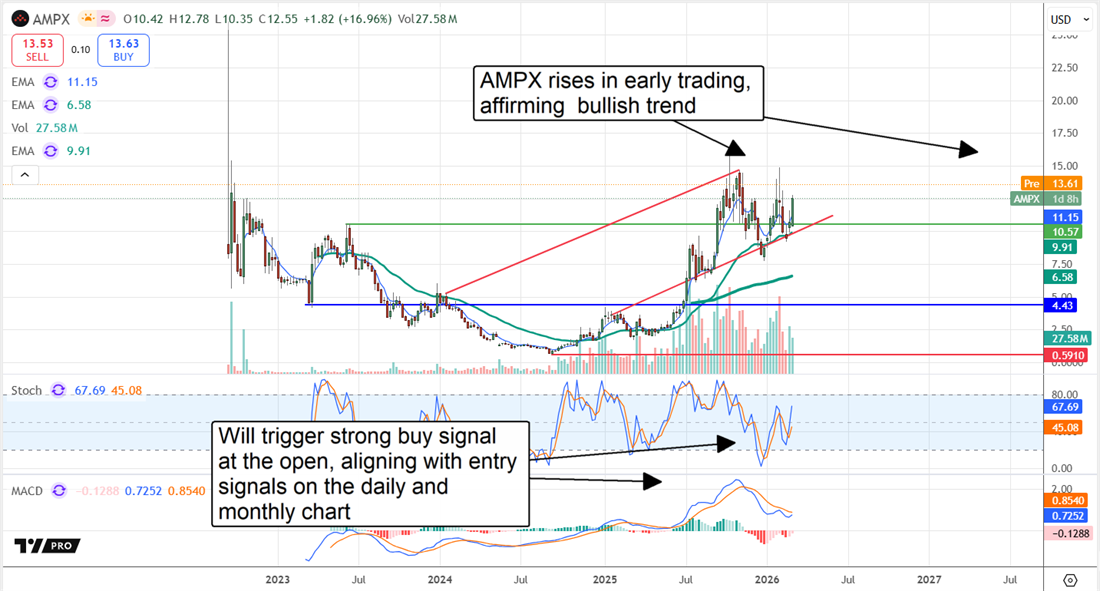
The stock’s price action also shows positive signals. Monthly, weekly, and daily charts converged with bullish indicators following the release. While periodic pullbacks are possible, those dips may present buying opportunities.
Long term, the stock may sustain upward momentum for many quarters — potentially several years — with technical projections suggesting a baseline target of $30.
This Month’s Bonus Content
Qualcomm’s Robotics Push Could Be Bigger Than the Market Thinks
Authored by Sam Quirke. First Published: 3/5/2026.
Key Points
Qualcomm’s CEO flagged robotics as a major growth opportunity, projecting the segment will “start to get scale within the next two years.”
Analysts at Wells Fargo and Loop Capital recently upgraded the stock and raised price targets to $185, citing easing pressures and emerging growth drivers.
The chipmaker’s push into automotive, IoT, and edge AI is starting to show traction—robotics could become the next pillar of its diversification strategy.
Special Report: [Sponsorship-Ad-6-Format3]
Shares of Qualcomm Inc. (NASDAQ: QCOM) were trading just below $140 early in the week, down approximately 25% from their January high. While they had been under pressure since before Christmas, much of the recent decline followed weak forward guidance in the company’s latest earnings report.
The tech giant has posted modest gains since its early-February low, but the move looks more like consolidation than the start of a major comeback. For many investors, Qualcomm still carries the perception of being overly dependent on smartphones at a time when the broader semiconductor industry is being defined by data-center artificial intelligence demand.
Yet a new narrative may be quietly forming that challenges that assumption.
Qualcomm’s New Growth Story Beyond Smartphones
In comments earlier this week, Qualcomm’s CEO Cristiano Amon pointed to robotics as a major opportunity for the company’s next phase of growth. Speaking about the evolution of AI-enabled devices, Amon said he expects robotics to “start to get scale within the next two years.”
That remark may not seem revolutionary on its own, but it fits into a broader shift in Qualcomm’s strategy. The company has spent the past several years diversifying beyond smartphones, building new revenue streams in automotive chips, Internet of Things (IoT) devices, and edge AI computing. Robotics could become the next extension of that push.
Qualcomm has already introduced specialized processors designed for robotics systems, applying the same architecture principles that made its Snapdragon chips dominant in mobile devices. The idea is simple: robots, industrial machines, and autonomous systems require the low-power, high-performance computing Qualcomm provides. If robotics adoption accelerates over the next decade, that positioning could prove extremely valuable.
Why the Market Has Been Skeptical on QCOM
Despite the long-term opportunity, the market has remained cautious on Qualcomm—and for good reason. The company’s fortunes have historically been tied closely to smartphone demand, and the global handset market has struggled to regain momentum in recent years.
Weak guidance last month did Qualcomm no favors, reinforcing the perception that the company remains vulnerable to cyclical slowdowns in mobile devices. That narrative has weighed heavily on the stock, especially as investors pour capital into companies seen as clearer beneficiaries of the generative AI boom. The result has been persistent underperformance relative to many of its tech and semiconductor peers.
Analysts Are Starting to Shift Tone
The overall analyst consensus on Qualcomm remains a Hold, but recent commentary has become slightly more constructive. Wells Fargo lifted its rating from Underweight to Equal Weight last week, and Loop Capital went one step further by re-rating the stock to Buy. Both groups also raised their price targets to $185, implying more than 30% upside from current levels.
The view is that several of the pressures that weighed on Qualcomm in recent quarters are beginning to ease just as new growth opportunities are emerging. The company’s expanding data-center ambitions and its potential role in the AI inference market are additional reasons some analysts are more bullish heading into the rest of the year.
Those shifts may seem modest, but they matter because Qualcomm has spent much of the past year fighting a narrative that it’s been left behind in the AI race. If robotics, alongside automotive chips and edge AI platforms, begin contributing meaningfully to revenue growth, that narrative could change quickly.
A Diversification Strategy Taking Shape
Part of the reason analysts are becoming more constructive is that Qualcomm’s diversification strategy is starting to show tangible progress. The company expects its reliance on Apple Inc. (NASDAQ: AAPL) to decline over time while its other segments expand steadily.
At the same time, Qualcomm has been investing heavily in AI-related technologies, including acquisitions aimed at strengthening its presence in data centers and high-performance computing.
These initiatives point to a common objective: reducing Qualcomm’s dependence on smartphones and building a broader semiconductor platform story. Robotics, if Amon’s timeline proves accurate, could become the next pillar of that strategy.
Qualcomm Robotics Traction Could Shift Investor Sentiment
If Qualcomm begins demonstrating real traction in robotics over the coming quarters, investors may reassess the company’s long-term growth profile. For now, the stock’s behavior suggests the market is still waiting for proof. Qualcomm’s shares have stabilized since early February but have yet to mount a decisive recovery. That cautious price action reflects the tension between a weak near-term outlook and what could be a compelling long-term opportunity.
Investors should watch for the stock to consolidate around the $140 level or higher as confirmation that bulls are regaining control. A steady run of higher lows in the weeks ahead would go a long way toward confirming that the market is willing to back Qualcomm’s evolving growth story.
Thank you for subscribing to Earnings360, a morning newsletter that summarizes quarterly earnings for public companies that trade on U.S. markets.
This email communication is a paid advertisement for T3 Live, a third-party advertiser of Earnings360 and MarketBeat.
If you need assistance with your account, please feel free to contact our South Dakota based support team at contact@marketbeat.com.
If you no longer wish to receive email from Earnings360, you can unsubscribe.
Trump is about to cut Iran off at the knees. One tiny North Carolina town supplies 80% of the world’s most critical semiconductor material. Business Insider calls it “crucial to make chips that power everything from smartphones to data centers.” When Trump bans exports, Iran’s tech infrastructure crumbles — and every chipmaker on Earth is forced to relocate to U.S. soil. Morgan Stanley estimates the reshoring boom triggers a $10 trillion transformation. A handful of U.S. companies stand to capture most of it.
The headlines scream about oil and regime change in the Middle East. But behind the scenes, President Trump is about to unleash something far more shocking in the homeland.
You won’t hear about it on Fox Business or CNBC.
But it’s about to have a seismic impact on the wealth of every American patriot.
It’s the boldest initiative of President Trump’s second term by far – and it’s not even close.
Iran Conflict Reveals Trump’s Most Powerful Weapon
It’s not missiles. It’s not sanctions. It’s not tariffs. It’s a commodity found in the Appalachian Mountains. America controls 80% of the one material every enemy nation needs to build advanced technology — semiconductors, AI chips, military electronics. Trump is expected to weaponize this monopoly with an export ban that cuts off China and Iran overnight. Morgan Stanley estimates the reshoring boom triggers a $10 trillion transformation.
Alpha Wire Daily tracks developing activity across small caps—where subtle shifts begin to take shape. These are often the setups that appear before broader attention builds.
OIL & MIDDLE EAST DEVELOPMENTS: During Monday’s session, oil briefly spiked above $100 per barrel before retreating after comments from Donald Trump suggested the conflict in Iran may be nearing an end, sparking a late-day rally in U.S. equities. Secretary of Energy Chris Wright claimed on social media that the U.S. Navy had successfully escorted a tanker through the Strait of Hormuz, though the post was later removed and the White House denied the statement. Investors closely monitored developments in the Middle East, with G7 ministers meeting on Tuesday to discuss a potential coordinated release of oil from strategic reserves after failing to reach agreement on Monday. Saudi Aramco CEO Amin Nasser warned that further disruptions to global energy supply could prove “catastrophic” as tensions continue to escalate.
INTERNATIONAL MARKETS: Overseas, Asian markets moved sharply higher overnight amid optimism over a potential near-term de-escalation. Japan’s Nikkei 225 rose nearly 3%, while Korea’s KOSPI Composite Index gained more than 5%. European markets also traded higher, supported by the pullback in oil prices. Despite recent gains, Japan’s Nikkei 225 is down nearly 8% month-to-date, Korea’s KOSPI has fallen more than 11%, and the EURO STOXX 50 is down over 5%. Bond yields edged up, with the 10-year U.S. Treasury yield starting the day around 4.12%, while gold advanced as the dollar weakened, with traders assessing the outlook for potential monetary easing.
CORPORATE EARNINGS & MOVERS:
Hewlett Packard Enterprise (HPE) slipped despite reporting quarterly earnings that topped expectations, while its forward guidance largely matched analyst forecasts.
Shares of Hims & Hers Health (HIMS) surged 41% after reports that Novo Nordisk will distribute its weight-loss medications through the company’s platform.
Centene (CNC) fell as membership in some Affordable Care Act plans declined.
CrowdStrike (CRWD) gained after a Morgan Stanley upgrade to “overweight.”
Qualcomm (QCOM) dropped on a BofA Securities “underperform” rating.
Kohl’s (KSS) declined after missing quarterly revenue expectations, while cruise line stocks recovered from last week’s declines.
Gap Inc. (GAP) extended earnings-related losses.
Rivian Automotive (RIVN) climbed following a TD Cowen upgrade and optimistic sales projections for its upcoming R2 SUV.
Defense contractors Lockheed Martin (LMT) and Northrop Grumman (NOC) fell after Trump comments suggested the conflict could soon end.
Bitcoin rose modestly but remained below $70,000.
MARKET HIGHLIGHTS & ECONOMIC NEWS:
U.S. equity markets traded slightly higher on Tuesday, with oil prices holding just under $90 per barrel.
Existing home sales unexpectedly rose in February as lower mortgage rates improved affordability, though limited housing supply and geopolitical risks could slow recovery.
In legal news, a federal judge temporarily blocked Perplexity AI from scraping Amazon’s website, marking a key development in AI data-access disputes.
In corporate and tech moves, Meta Platforms acquired AI-agent social network Moltbook.
Google expanded its Pentagon AI partnership with new agent tools.
Nvidia made a major investment in Mira Murati’s Thinking Machines Lab to advance AI systems using Nvidia computing infrastructure.
U.S. Existing Home Sales Rise as Lower Mortgage Rates Improve Affordability
U.S. existing home sales unexpectedly increased in February as declining mortgage rates and slower home-price growth brought buyers back into the market. However, limited housing supply could still restrain activity during the upcoming spring selling season. The report from the National Association of Realtors suggested early signs of improvement in the housing market, with affordability gradually strengthening. Notably, the share of first-time homebuyers reached its highest level in five years, highlighting renewed participation among new entrants to the housing market. Housing affordability has also become a key political issue ahead of the November midterm elections.
Google Expands Pentagon AI Partnership with New Military Agent Tools
Google is expanding its partnership with the U.S. military by introducing new tools that allow Pentagon personnel to build custom AI assistants for everyday administrative work. The move deepens the company’s role in defense technology at a time when the government is facing legal challenges from other AI firms over access to military systems. Google announced Tuesday that civilian and military staff will soon be able to create personalized AI agents through the Pentagon’s enterprise AI portal, GenAI.mil. The platform will provide access to a new tool called Agent Designer, enabling users across the Department of Defense to build digital assistants without requiring advanced programming skills.
Earnings Spotlight: Adobe (ADBE)
Adobe (ADBE) is set to report fiscal first-quarter 2026 results after the market closes on March 12, 2026. Analysts expect earnings of about $5.87 per share and revenue near $6.275 billion for the quarter, implying mid-single-digit top-line growth from a year earlier. Street estimates point to continued strength in subscription revenue, with analysts penciling in roughly $6.09 billion for the services that underpin Adobe’s recurring-revenue model.
What’s Ahead
Inflation and its implications for monetary policy will be a central focus for investors this week. February consumer price index (CPI) data is due today, followed by personal consumption expenditures (PCE) data on Friday. Economists expect both headline and core CPI to rise 2.5% year over year, while headline and core PCE are projected to increase 2.9%.
March 11: February CPI and core CPI and expected earnings from Campbell’s (CPB).
March 12: January factory orders, January housing starts and building permits, and expected earnings from Dollar General (DG), Dick’s Sporting Goods (DKS), Adobe (ADBE), and Lennar (LEN).
March 13: January PCE, Q4 GDP second estimate, University of Michigan preliminary March Consumer Sentiment, and January Job Openings and Labor Turnover Survey (JOLTS).
March 16: February industrial production, and expected earnings from Dollar Tree (DLTR).
March 17: Expected earnings from lululemon (LULU) and DocuSign (DOCU).
Disclaimer: We are engaged in the business of advertising and promoting companies. All content on our website is for informational purposes only and should not be construed as an offer or solicitation of an offer to buy or sell securities. Neither the information presented nor any statement or expression of opinion, or any other matter herein, directly or indirectly constitutes a solicitation of the purchase or sale of any securities. Neither the owner of Trading Wire nor any of its members, officers, directors, contractors or employees are licensed broker-dealers, account representatives, market makers, investment bankers, investment advisers, analyst or underwriters. Investing in securities, including the securities of those companies profiled or discussed on this website is for individuals tolerant of high risks. Viewers should always consult with a licensed securities professional before purchasing or selling any securities of companies profiled or discussed on Trading Wire. It is possible that a viewer’s entire investment may be lost or impaired due to the speculative nature of the companies profiled. Remember, never invest in any security of a company profiled or discussed on this website unless you can afford to lose your entire investment. Also, investing in micro-cap securities is highly speculative and carries an extremely high degree of risk. Trading Wire makes no recommendation that the securities of the companies profiled or discussed on this website should be purchased, sold or held by viewers that learn of the profiled companies through our website.
Some of the content on this website contains “forward-looking statements.” Such statements may be preceded by the words “intends,” “may,” “will,” “plans,” “expects,” “anticipates,” “projects,” “predicts,” “estimates,” “aims,” “believes,” “hopes,” “potential,” or similar words. Forward-looking statements are not guarantees of future performance, are based on certain assumptions, and are subject to various known and unknown risks and uncertainties, many of which may be beyond a company’s control, and cannot be predicted or quantified, and, consequently, actual results may differ materially from those expressed or implied by such forward-looking statements. It is hereby noted that forward-looking statements contained herein may include everything other than historical information, involve risk and uncertainties that may affect a company’s actual results of operation. A company’s actual performance could greatly differ from those described in any forward-looking statements or announcements mentioned on this website or the websites contained within. Factors that should be considered that could cause actual results to differ include: the size and growth of the market for the company’s products; the company’s ability to fund its capital requirements in the near term and in the long term; pricing pressures; unforeseen and/or unexpected circumstances in happenings; etc. and the risk factors and other factors set forth in the company’s filings with the Securities and Exchange Commission. However, a company’s past performance does not guarantee future results.
Generally, the information regarding a company profiled or discussed on this website is provided from public sources tradingwire.com makes no representations, warranties or guarantees as to the accuracy or completeness of the information provided or discussed. Viewers should not rely solely on the information obtained through our website or in communications originating from our website. Viewers should use the information provided by us regarding the profiled companies as a starting point for additional independent research on the companies profiled or discussed in order to allow the viewer to form his or her own opinion regarding investing in the securities of such companies. Factual statements, or the similar, made by the profiled companies are made as of the date stated and are subject to change without notice and Trading Wire has no obligation to update any of the information provided. Trading Wire, its owners, officers, directors, contractors and employees are not responsible for errors and omissions.
From time to time certain content on this website is written and published by our employees or third parties. In addition to information about our profiled companies, from time to time, our website will contain the symbols of companies and/or news feeds about companies that are not being profiled by us but are merely illustrative of certain activity in the micro cap or penny stock market that we are highlighting. Viewers are advised that all analysis reports and news feeds are issued solely for informational purposes. Any opinions expressed are subject to change without notice. It is also possible that one or more of the companies discussed or profiled on this website may not have approved certain or any statements within the website. Trading Wire encourages viewers to supplement the information obtained from this website with independent research and other professional advice. The content on this website is based on sources which we believe to be reliable but is not guaranteed by us as being accurate and does not purport to be a complete statement or summary of the available data. Third Party Web Sites and Other Information This website may provide hyperlinks to third party websites or access to third party content.Trading Wire, its owners, officers, directors, contractors and employees are not responsible for errors and omissions nor does Trading Wire control, endorse, or guarantee any content found in such sites. Trading Wire does not control, endorse, or guarantee content found in such sites. By accessing, viewing, or using the website or communications originating from the website, you agree that Trading Wire, its owners, officers, directors, contractors and employees, are not responsible for any content, associated links, resources, or services associated with a third party website. You further agree that Trading Wire, its owners, officers, directors, contractors and employees shall not be liable for any loss or damage of any sort associated with your use of third party content. Links and access to these sites are provided for your convenience only. Trading Wire uses third parties to disseminate information to subscribers. Although we take precautions to prevent others from obtaining our subscriber list, there is a risk that our subscriber list, through no wrong doing on our part, could end up in the hands of an unauthorized party and that subscribers will receive communications from unauthorized third parties. We encourage viewers to invest carefully and read the investor issuer information available at the web sites of the United States Securities and Exchange Commission (SEC). The SEC has launched an investor-focused website to help you invest wisely and avoid fraud at www.investor.gov and filings made by public companies can be viewed at www.sec.gov and/or the Financial Industry Regulatory Authority (FINRA) at: www.finra.org. In addition, FINRA has published information at its website on how to invest carefully at www.finra.org/Investors/index.htm.
GitLab Sell-Off Overdone: AI and Cash Flow Signal a Rebound
Author: Thomas Hughes. Date Posted: 3/4/2026.
Key Points
GitLab is well-positioned for the age of AI inference, as it enables superior outcomes at all stages of the software development lifecycle.
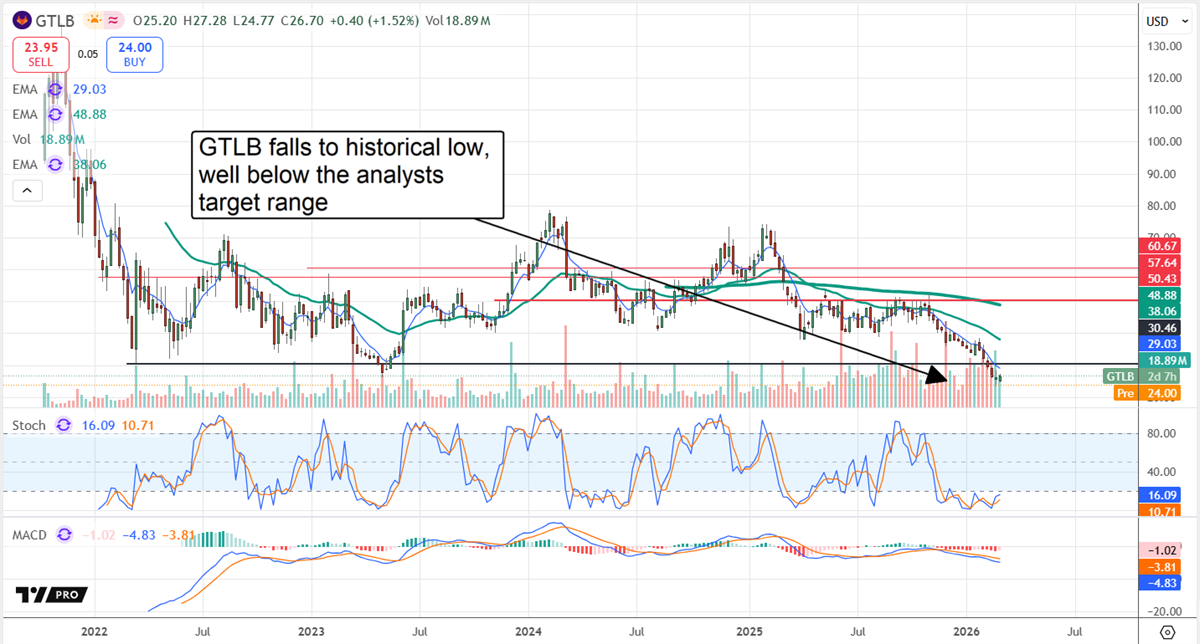
Tepid guidance and a weak analyst response sent shares to long-term lows, where institutions are likely to buy.
Cash flow is king in 2026, and GitLab has it, as evidenced by its inaugural $400 million share buyback authorization.
Special Report: [Sponsorship-Ad-6-Format3]
Fears of slowing growth and AI disruption drove GitLab (NASDAQ: GTLB) shares to long-term lows in early March. That sell-off—overdone from the start—has pushed the stock into ultra-deep value territory, creating an attractive buying opportunity.
While AI-related worries have clouded the near-term outlook, the company continues to grow and is well-positioned for the AI inference era. Its platform and newer products embed AI functionality across the software lifecycle, improving efficiency and outcomes while maintaining security, compliance, and governance.
Our investment research analysts are going to be releasing their next investment idea tomorrow morning, around 10:00 AM Eastern time.Add yourself to the distribution list here.
Evidence of this positioning—and of a healthy outlook—appears in its cash flow and balance sheet, which supported an authorized share buyback. The company is cash-flow positive despite aggressive investment, expects improving cash flows, and plans to spend up to $400 million on repurchases.
That buyback represents roughly 10% of the post-release market cap, strengthening an already solid support base. Investors can reasonably expect GitLab to repurchase shares on price pullbacks, such as the early-March dip to record-low levels.
The balance sheet highlights a strong and strengthening capital position and improving shareholder value. At fiscal year-end, current assets rose across categories, with cash and equivalents well above liabilities. The company has no long-term debt, total liabilities are below equity, and equity increased about 27% for the year.
Valuation, Institutions, and Analysts Point to GTLB’s Robust Upside Potential
GitLab’s shares could double from their March lows based on consensus earnings estimates alone. Forecasts imply a high-teens to low-20s% compound annual growth rate (CAGR) through the middle of the next decade, placing the stock near 10x its 2035 consensus. In one scenario, the shares could rise at least 100% to align with broad market averages, or 200%+ to approach the multiples of established blue-chip tech peers.
Further evidence of GitLab’s value comes from institutional and analyst trends. Institutional investors, including public and private funds, own roughly 95% of the stock and have been net buyers.
MarketBeat data show institutions have been buying on balance for 13 consecutive quarters, with buying activity accelerating in 2025 and again in early 2026.
That creates a strong support base likely to remain a tailwind for the shares once a rebound gains traction.
Analysts reacted cautiously to GitLab’s fiscal Q4 2026 earnings report, but that response came against a high bar. MarketBeat tracked six revisions within 12 hours of the release: one downgrade, five price-target cuts, and one affirmation. Overall sentiment was only modestly affected.
Those six actions still imply a stance stronger than a broad Moderate Buy consensus; the price targets, while trimmed at the low end, average just below the broader consensus and imply roughly 65% upside.
GitLab Offers Mixed Guidance After Strong Report
GitLab delivered a solid fiscal year 2026 (FY2026) and Q4. The company reported $260.4 million in net revenue, up about 23.2% year-over-year and 320 basis points above consensus. Strength was driven by larger customers: revenue from large customers rose roughly 18% and from mega-sized customers about 26%, with an 8% increase across the broader customer base.
Net retention rate (NRR) was strong at 118%, and forward-looking remaining performance obligation (RPO) grew meaningfully—up 24% on a current-currency basis and 20% on a reported basis—suggesting durable growth ahead.
Margin dynamics were mixed but generally positive. Gross margin contracted by 200 basis points, but improvements in operating efficiency offset that impact. Adjusted operating marginexpanded by 300 basis points, helping drive a 42.8% increase in operating income. Higher spending did reduce adjusted EPS and free cash flow year over year; however, adjusted EPS of $0.30 beat estimates by $0.07, which undercuts a sell-the-news narrative.
Guidance was mixed: revenue guidance slightly missed consensus, while earnings guidance looked strong. The company expects more than 17% revenue growth this year and wider margins; management’s guidance for adjusted earnings was above consensus (and may be conservative). GitLab outlined five initiatives to drive growth, including expanding its go-to-market presence, accelerating client acquisition, optimizing pricing and packaging, executing its AI strategy, and other operational improvements.
Additional Reading from MarketBeat Media
These 3 Cash Flow Machines Provide Stability in Uncertain Markets
Reported by Nathan Reiff. Article Posted: 3/6/2026.
Key Points
Cash flow generation is a key attribute of stable companies, allowing them flexibility to not only maintain operations but also to grow and to return value to shareholders via dividends or buybacks.
Gilead Sciences and AbbVie are two large biopharma firms with a compelling history of cash flow generation, helping to facilitate continued R&D and pipeline development, among other things.
Visa converts about half or more of its revenue to free cash flow, capitalizing on its high-margin business to facilitate growth and dividend payments.
Special Report: [Sponsorship-Ad-6-Format3]
When companies face difficult markets, cash flow becomes a critical factor in determining their ability to survive. If a firm cannot meet its near-term obligations with the cash it has on hand, it risks serious trouble. Equally important, strong cash flow enables longer-term planning—everything from expansion and acquisitions to strategic returns of capital to shareholders.
Cash flow is only one metric among many, but it may be particularly important for investors seeking companies that can remain steady amid broad market uncertainty in 2026. The three companies below are household names and major industry players that also have strong cash-flow histories to support their plans for continued growth.
Strong Free Cash Flow Yield and Commitment to Returning Value to Investors
Anchored by top-selling drugs for COVID-19, HIV, certain cancers and more, Gilead Sciences Inc. (NASDAQ: GILD) is one of the largest biopharma firms available to investors. The company generates compelling free cash flow relative to its share price—its free cash flow yield is around 6%.
Even better for investors, Gilead has committed to returning at least half of its free cash flow each year to shareholders. In 2025, including its dividend distributions, Gilead returned 63% of its annual free cash flow to stockholders.
Despite its scale and established position, Gilead has continued to grow. In Q4 2025, it beat analyst expectations for both earnings per share and revenue, propelled by legacy products and a robust pipeline. In 2026 the company expects at least four major commercial rollouts of new products, which should help diversify its revenue mix.
Gilead faces significant competition—especially in oncology, where some investors would like to see a larger contribution to total sales—but a large majority of Wall Street analysts have bullish ratings on GILD shares. Analysts also see roughly 6% upside potential even after the stock’s more than 28% rise over the past year.
Massive Dividend Growth Made Possible By Solid Cash Generation Power
Another major biopharma name, AbbVie (NYSE: ABBV), posts a free cash flow yield above 5%, which is strong for a company of its size and sector. While AbbVie operates across many therapeutic areas, one of its most compelling attractions for investors is its dividend.
Although the company reports a high dividend payout ratio—about 293%—which could concern some investors, that payout is underpinned by robust free cash flow. In 2025, for example, AbbVie generated nearly $18 billion in free cash flow while distributing roughly $11.7 billion in total dividends.
The company has demonstrated continued momentum, beating Wall Street expectations for both earnings and revenue in Q4 2025 and providing higher guidance at the time. Much of this growth has been driven by two leading drugs, Skyrizi and Rinvoq, and AbbVie continues to invest heavily in R&D to expand its pipeline.
Payments giant Visa Inc. (NYSE: V) operates a high-margin business that generates substantial free cash flow, often converting roughly half of its revenue into free cash flow each quarter. With strong top-line performance—a 14.6% year-over-year revenue improvement in the latest period, for example—Visa is a reliable cash machine for many investors.
Despite macroeconomic headwinds such as tariffs and inflation, Visa’s payments volume and processed transactions continue to rise, reflecting resilient consumer spending. That strength has allowed Visa to increase its dividend while maintaining a manageable payout ratio; the company currently offers a yield of 0.83% with a payout ratio near 25.1%. It’s no surprise that analysts view Visa as a solid Buy, forecasting roughly 22% upside potential going forward.
Thank you for subscribing to DividendStocks.com’s daily newsletter for dividend and income investors that covers ex-dividend stocks, new dividend declarations, dividend stock ideas, and the latest market news.
This message is a sponsored email sent on behalf of Timothy Sykes, a third-party advertiser of DividendStocks.com and MarketBeat.
If you have questions or concerns about your newsletter, please feel free to email our South Dakota based support team at contact@marketbeat.com.
If you no longer wish to receive email from DividendStocks.com, you can unsubscribe.
Quiet Outperformance From an Overlooked Dividend ETF
Written by Nathan Reiff on March 9, 2026
Key Points
With nearly 20% in returns in the last year and more than 5% year-to-date, DGRO is an ETF providing growth potential as well as strong dividend opportunities.
The fund’s strategy stands out for its emphasis on dividend growth history, helping to ensure that it avoids dividend yield traps and rewards companies with stability and healthy cash flow.
DGRO provides broad exposure to nearly 400 names across many sectors and industries, with an emphasis on financials, health care, and information technology stocks.
When it comes to dividend stocks, it’s easy to be tempted by companies based on a ranking of the highest dividend yields. After all, dividend yield is a direct measure of the cash payout a company provides for investors relative to its price, and the higher the yield the more enticing the distribution is, right? In actuality, there are other factors to consider when selecting dividend names, and investors attuned to the history of a dividend’s growth—or lack thereof—may end up identifying more stable and successful investments.
Still, close monitoring of a potential dividend investment’s history of payouts and growth can be difficult to manage for investors looking to trade quickly, and there always exists the risk that a company will face unexpected challenges and have to make cuts to its distributions. To diversify dividend investments, it may help to consider a dividend-focused exchange-traded fund (ETF), which not only holds a larger group of dividend-paying companies but also does the work of selecting and balancing the portfolio. For a broad view of the potent dividend growth space, consider the iShares Core Dividend Growth ETF (NYSEARCA: DGRO).
DGRO is a passively managed fund tracking the Morningstar US Dividend Growth Index, which targets U.S. equities that have both a history of dividend growth and the potential to sustain that growth going forward.
It does this by identifying (from a broader pool of U.S. stocks) companies that have at least five years of uninterrupted growth to their annual dividends, with an earnings payout ratio below 75%.
Interestingly, DGRO’s index excludes companies in the top 10% of dividend yield before screening for dividend growth and payout ratio, perhaps a bid to avoid companies that falsely present a strong dividend case but are actually in trouble because their share price has collapsed.
In the end, DGRO holds roughly 400 positions in a set of companies broadly diversified by market capitalization and sector. The fund does lean toward financials stocks, health care names, and companies representing the information technology sector—together, these three categories represent about half of the total portfolio.
DGRO’s Performance, Portfolio, and Prospects Set It Apart
In the last year, DGRO has returned about 13%, a standout in the dividend space, where companies most commonly deliver value to shareholders via disbursements, not share appreciation. Even as the broader S&P 500 has remained in negative territory to begin 2026, DGRO has returned more than 2% year-to-date (YTD). Of course, investors can also expect a strong dividend from the fund, with a yield of nearly 2% in early March.
Looking more closely at DGRO’s portfolio, the fund takes a fairly broad view by not assigning any single position a very high portfolio weighting. Exxon Mobil Corp. (NYSE: XOM), the massive energy firm and dividend aristocrat with a yield of 2.7% and a history of regular increases to payouts going back more than four decades, is the largest position, but it only occupies 3.6% of the portfolio. While most of the largest positions in DGRO’s basket are indeed well-known dividend stocks, it also contains lesser-known firms for added diversification.
Big-name dividend plays are not necessarily a bad thing, as the emphasis on dividend growth can help to ensure that the companies DGRO holds are likely to be stable even during broader market upheaval. A brief look at some of the other top holdings finds solid dividend stalwarts like Johnson & Johnson (NYSE: JNJ), AbbVie Inc. (NYSE: ABBV), and Apple Inc. (NASDAQ: AAPL).
For an annual fee of 0.08%, DGRO is not the absolute cheapest dividend fund on the market—the massive Vanguard Dividend Appreciation ETF (NYSEARCA: VIG) with over $100 billion in assets under management (AUM) is an example of an alternative that comes in below that rate, with an expense ratio of 0.04%. However, DGRO has beaten VIG on both overall returns and dividend yield in recent periods. DGRO is a smaller fund with just about $39 billion in AUM, but its one-month average trading volume of 2.3 million eclipses its larger rival as well.
To be sure, there are plenty of other dividend ETFs available for investors looking to set up a passive income stream with minimal investment action, and investors would do well to consider multiple options before making a selection.